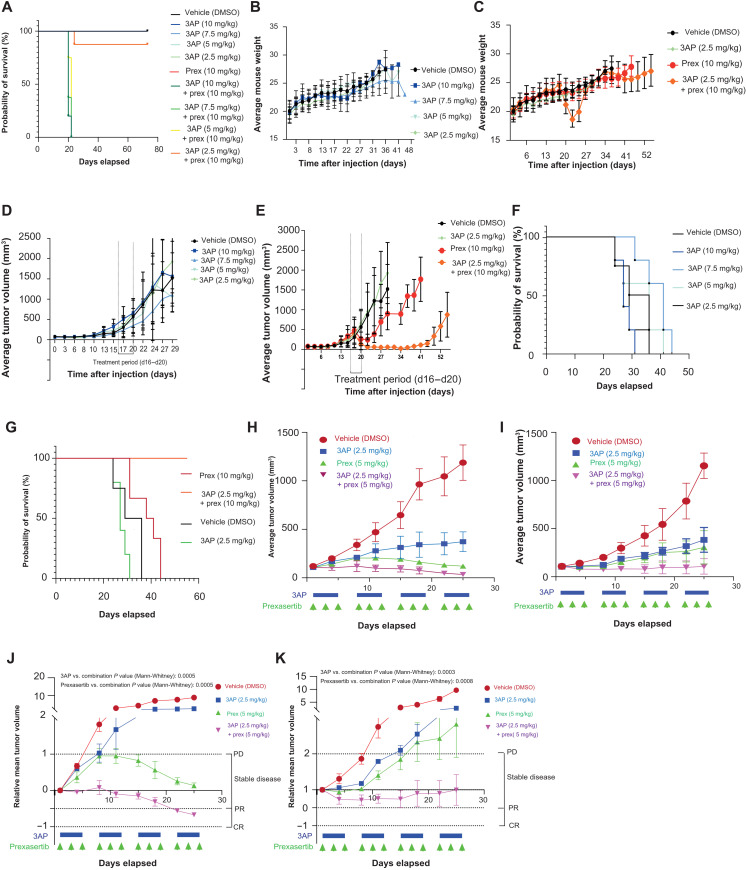
Fig. 9. In vivo validation of 3AP-prexasertib synergism.
(A) Survival probabilities were measured over time of control-treated, 3AP single compound–treated, and prexasertib-treated mice and mice treated with different concentration combinations of 3AP and prexasertib. Statistical analyses were performed using the log-rank (Mantel-Cox) test. (B) Time course analysis of the average mouse weight per 3AP treatment group included in this murine cell line xenograft study. (C) Time course analysis of the average mouse weight per 3AP, prexasertib, and combination treatment groups included in this murine cell line xenograft study. (D) Average tumor volume (TV) of the different 3AP treatment groups included in this murine cell line xenograft study. (E) Average TV of the 3AP, prexasertib, or combination treatment group included in this murine cell line xenograft study. (F) Time course analysis of the survival probabilities of the different 3AP treatment groups included in this murine cell line xenograft study. (G) Time course analysis of the survival probabilities of the 3AP, prexassertib, and combination treatment group included in the experiment. (H) Average TV of the 3AP, prexasertib, or combination treatment group included for the treatment schedule of a MYNC-nonamplified (p53 wild type) neuroblastoma PDX model. (I) Average TV of the 3AP, prexasertib, or combination treatment group included for the treatment schedule of a MYNC-amplified (p53 wild type, ALK R1275Q mutant) neuroblastoma PDX model. (J) Relative mean TV of the 3AP, prexasertib, or combination treatment group included for the treatment schedule of a MYNC-nonamplified (p53 wild type) neuroblastoma PDX model. (K) Relative mean TV of the 3AP, prexasertib, or combination treatment group included for the treatment schedule of a MYNC-amplified (p53 wild type, ALK R1275Q mutant) neuroblastoma PDX model. CR, complete response; PR, partial response; PD, progressive disease.

