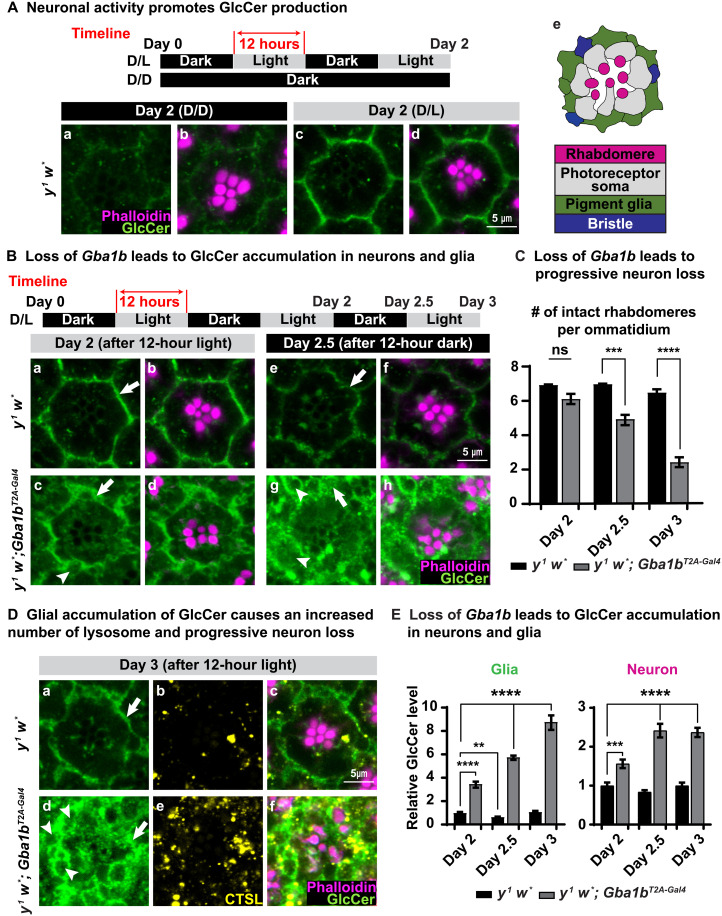
Fig. 4. Loss of Gba1b leads to GlcCer accumulation.
(A) Immunofluorescent images of fly retina of the indicated genotypes and the conditions under which the flies were raised: antibody against GlcCer in green, whereas phalloidin labels rhabdomeres in magenta. (a and b) Flies kept in the dark show very little GlcCer in the ommatidia of y1 w* (basal level). (c and d) After 12 hours of light exposure, GlcCer is synthesized and accumulates in retina of y w flies (n ≥ 9). (e) A cartoon image illustrating the structure of a fly ommatidium. (B) (a, b, e, and f) GlcCer accumulation in the glia of y1 w* flies is reduced after 12 hours of inactivation of neurons in the darkness. (a to d) After 2 days of D/L cycles, similar to y w flies, GlcCer accumulates in the glia of y1 w*; Gba1bT2A-Gal4 flies. However, GlcCer accumulates more in the neurons of y1 w*; Gba1bT2A-Gal4 flies. (c, d, g, and h) The glial accumulation of GlcCer fails to be degraded upon exposure to 12 hours of darkness in retina of y1 w*; Gba1bT2A-Gal4 flies (n ≥ 9). (C) Loss of Gba1b leads to progressive neurodegeneration. Numbers of intact PRs per ommatidium in (B) and (D) were quantified. Error bars represent SEM (n ≥ 9); ***P < 0.001 and ****P < 0.0001. (D) (a, c, d, and f) GlcCer progressively accumulates in the retina of y1 w*; Gba1bT2A-Gal4 flies, which is highly enriched in the glial region. (b and e) CTSL (yellow) represents lysosomes. The number of lysosomes is increased in y1 w*; Gba1bT2A-Gal4 flies compared with y1 w* flies (n ≥ 9). (E) Quantification of relative GlcCer levels in (B) and (D). Error bars represent SEM (n ≥ 9); **P < 0.01, ***P < 0.001, and ****P < 0.0001. All flies that are tested in this experiment are phenotypically white.

