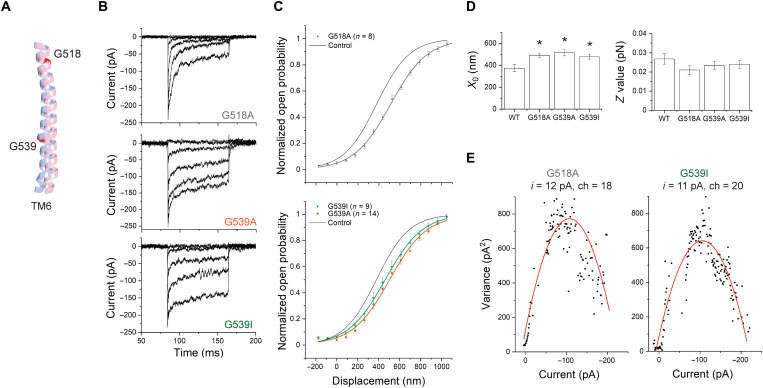
Fig. 4. Mutation of G518 or G539 on TM6 shifts the activation curves without changing the slope.
(A) Relative position of TM6 in open-like (pink) and closed-like (blue) structural models generated by AlphaFold2, showing G518 and G539. The predicted structures were aligned globally. (B) Representative transduction currents in IHCs expressing TMC1-G518A (top), TMC1-G539A (middle), and TMC1-G539I (bottom). (C) Activation curves from TMC1-G518A (top), TMC1-G539A (bottom), and TMC1-G539I (bottom). In both, the control WT-TMC1 activation curve is shown in black. (D) Fitting parameters X0 and Z. All three mutations shifted the activation curves (with P = 0.03, 0.01, and 0.02) without significantly changing slope (with P = 0.08, 0.44, and 0.13, respectively). (E) Nonstationary noise analysis for single hair cells expressing G518A (left) or G539I (right). Conductance did not significantly change from WT.

