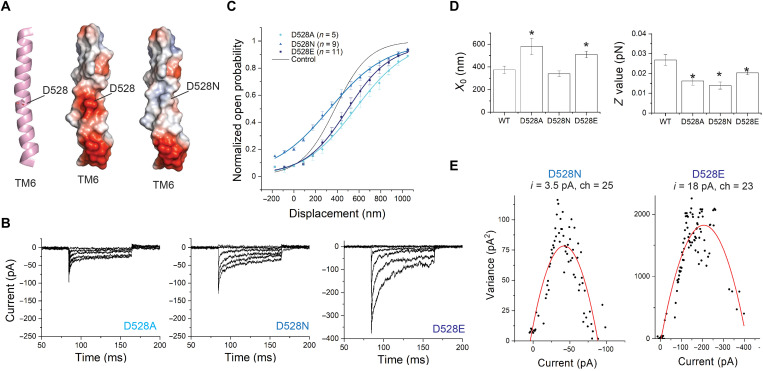
Fig. 5. Mutations of D528 shift the activation curve and change the slope and can change single-channel currents.
(A) Position of D528 within TM6 of TMC1. TM6 is shown cartoon representation (left) with the side chain of D528 highlighted in stick. The right panels show TM6 in electrostatic surface representation. Electrostatic surface potentials are colored red and blue for negative and positive charges, respectively, and white color represents neutral residues. (B) Transduction currents from TMC1 bearing D528A (left), D528N (middle), or D528E (right) mutations. (C) Activation curves from IHCs expressing TMC1-D528A (cyan), D528N (blue), or D528E (navy). The fit for WT-TMC1 is shown in black as reference. (D) X0 and Z for each mutation compared to WT. All three mutations reduced the slope (P < 0.01), whereas the midpoints of curves for D528A and D528E (P = 0.01 and 0.01), but not D528N (P = 0.33), were shifted. (E) Nonstationary noise analysis for TMC1-D528N (left) and TMC1-D528E (right). Preservation of charge in the D528E mutant preserved single-channel conductance.

