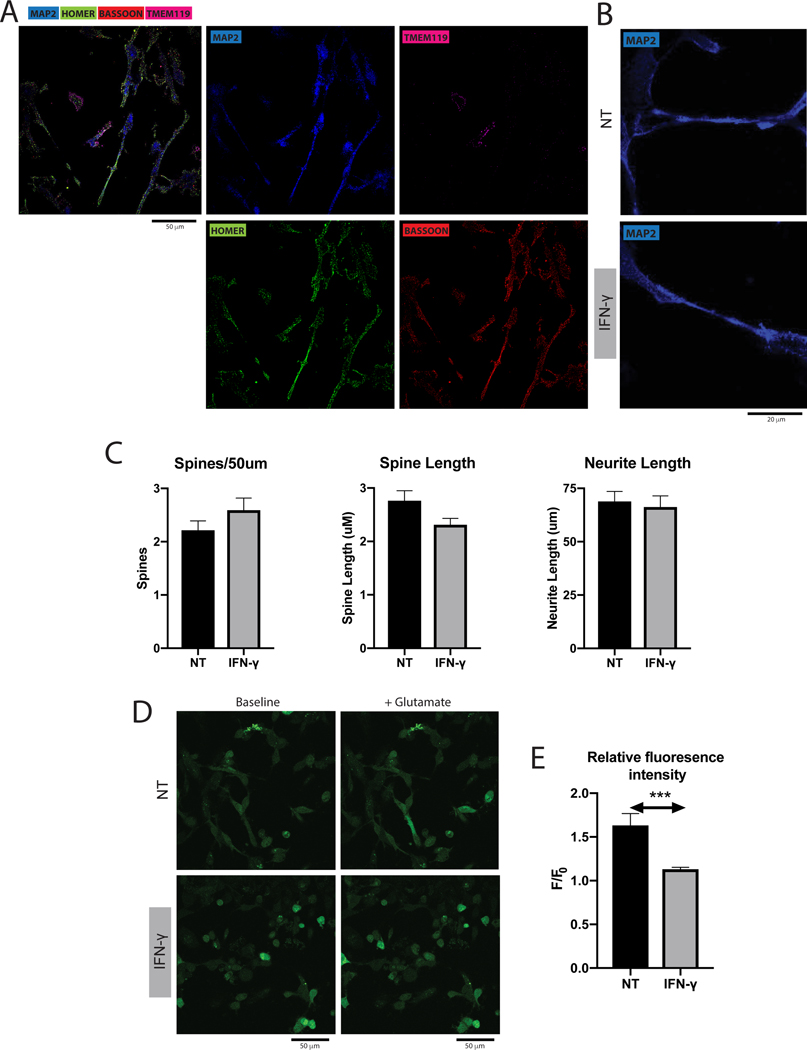
Figure 2.
A. Representative image of microglia and cortical neuron co-culture, with neurons stained for MAP2, pre-synaptic marker bassoon and post-synaptic marker homer, and microglia stained for TMEM119. B. Representative image of dendritic spines in microglia/neuron co-cultures, with and without IFN-γ treatment. Scale bar = 50 μm. C. Cortical neurons co-cultured with microglia treated with IFN-γ showed no significant differences when compared to untreated microglia in terms of spine count (Mann-Whitney test, P > 0.05, mean + SEM), spine length (Mann-Whitney test, P > 0.05, mean + SEM), or neurite length (unpaired t test, P > 0.05, mean + SEM). D. Representative images of cortical neurons in the presence of the calcium indicator Fluo-4AM, before and after glutamate stimulation and with and without IFN-γ treatment. E. Cortical neurons co-cultured in the presence of microglia treated with IFN-γ had significantly lower fluorescence intensity with glutamate stimulation when compared to neurons co-cultured with untreated microglia (Mann-Whitney test, P = 0.0003, mean + SEM).

