
Figure 4.
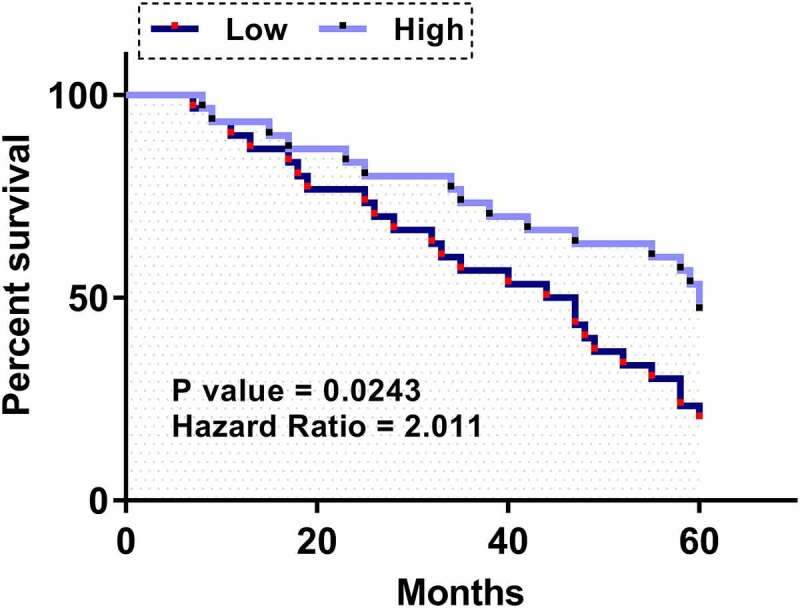
Prognostic value of plasma FAM230B for LA Survival analysis was performed by carrying out a 5-year follow-up study, followed by a survival curve analysis. The 60 LA patients were divided into high and low FAM230B levels groups (n = 30, cutoff value = median plasma expression level of FAM230B). Using the 5-year follow-up data, survival curves were plotted for both high and low FAM230B groups. Log-rank test was applied to compare survival curves.