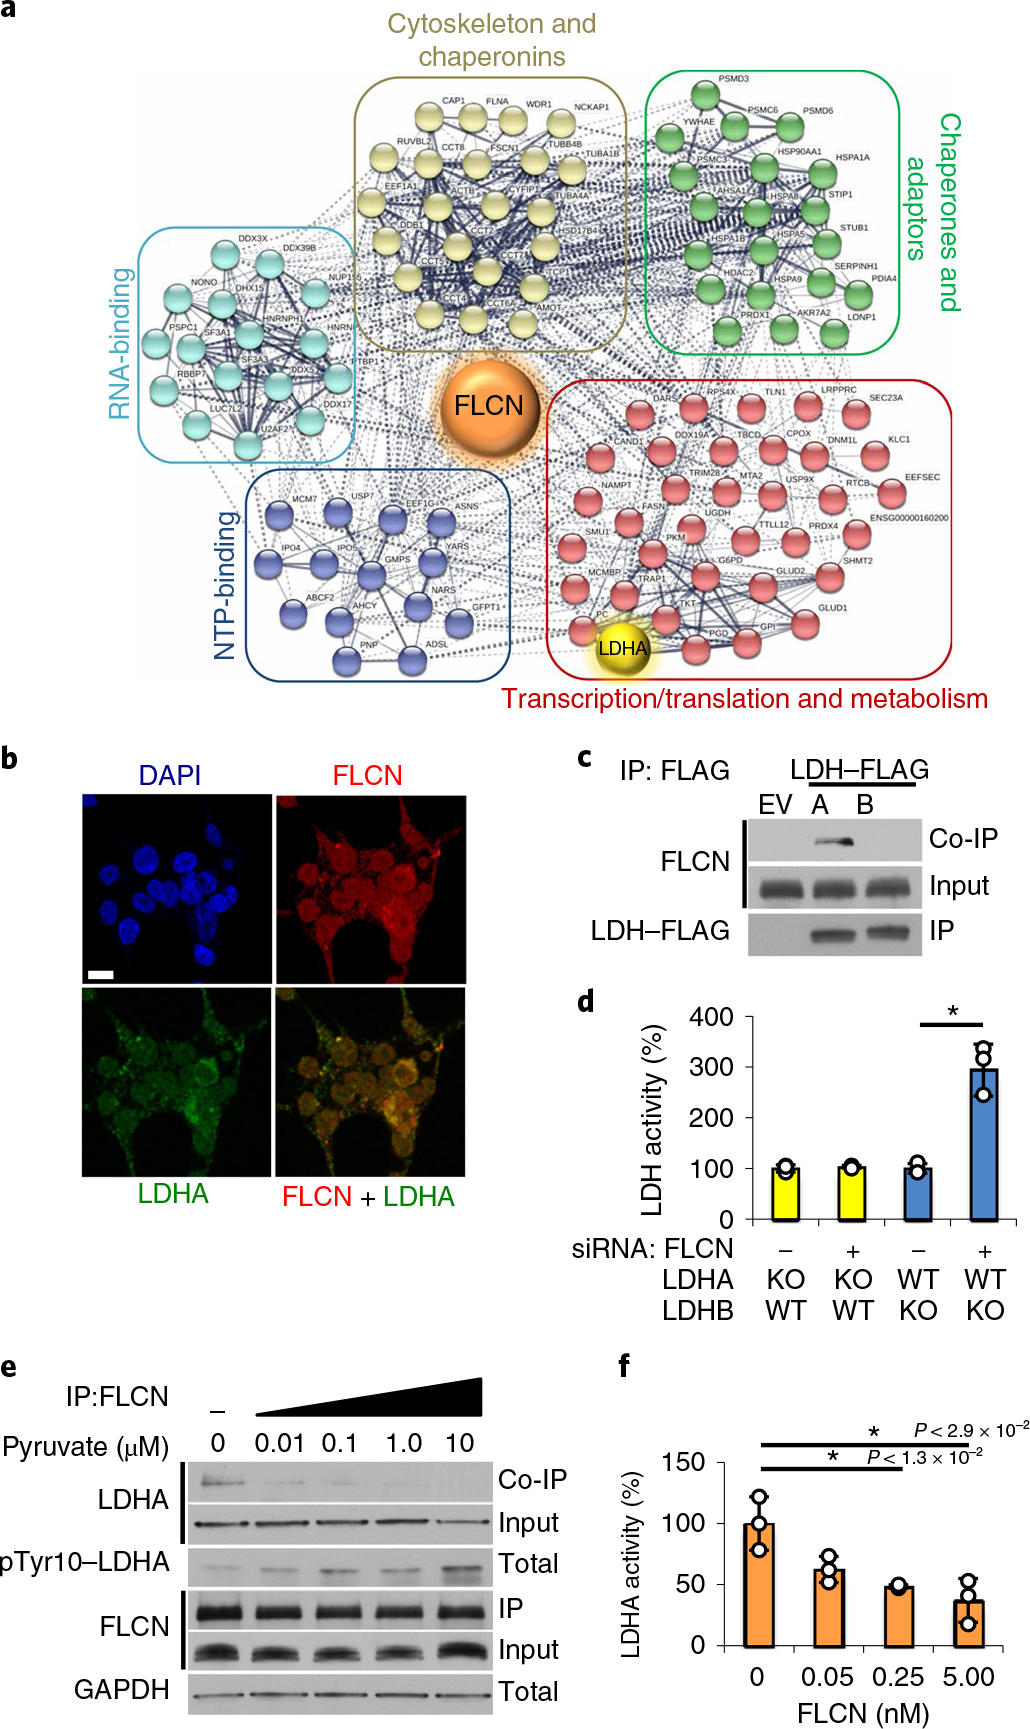
Fig. 1 |. The tumor suppressor FLCN specifically binds and inhibits LDHA.

a, FLCN-FLAG IP from HEK293 cells was subjected to matrix-assisted laser desorption/ionization–time-of-flight (MALDITOF) analysis. Colored circles are interacting proteins: green, chaperones and adaptors; red, transcription, translation and metabolism; blue, nucleotide-binding; cyan, RNA-binding; beige, chaperonins and cytoskeleton. The interactome was generated using STRING (string-db.org). b, Immunofluorescence imaging of HEK293 cells stained with anti-FLCN (red) and anti-LDHA (green) antibodies and DAPI (blue, nuclei). Scale bar, 10 μm. c, IP of LDHA-FLAG or LDHB-FLAG expressed in HEK293 cells immunoblotted with anti-FLCN to assess the interaction (co-IP). The blots are a representative example of five independent experiments. d, LDH activity measured in vitro using whole-cell lysates from LDHA or LDHB knockout HAP1 cells following treatment with siRNA targeting FLCN. Data are presented as mean ± s.d. (n = 3 independent samples) (*P < 9.0 × 10⁻³, unpaired Student’s t-test). e, Immunoblots of anti-FLCN IPs and whole-cell extracts following exogenous addition of pyruvate to HEK293s (treatment duration of 6 h). The blots are a representative example of three independent experiments. f, Activity of 10nM recombinant LDHA measured in the presence of increasing amounts of recombinant FLCN. Data are presented as mean ± s.d. (n = 3 independent samples). P values based on unpaired Student’s t-test: *P < 0.05. Source data for c–f are available online.
