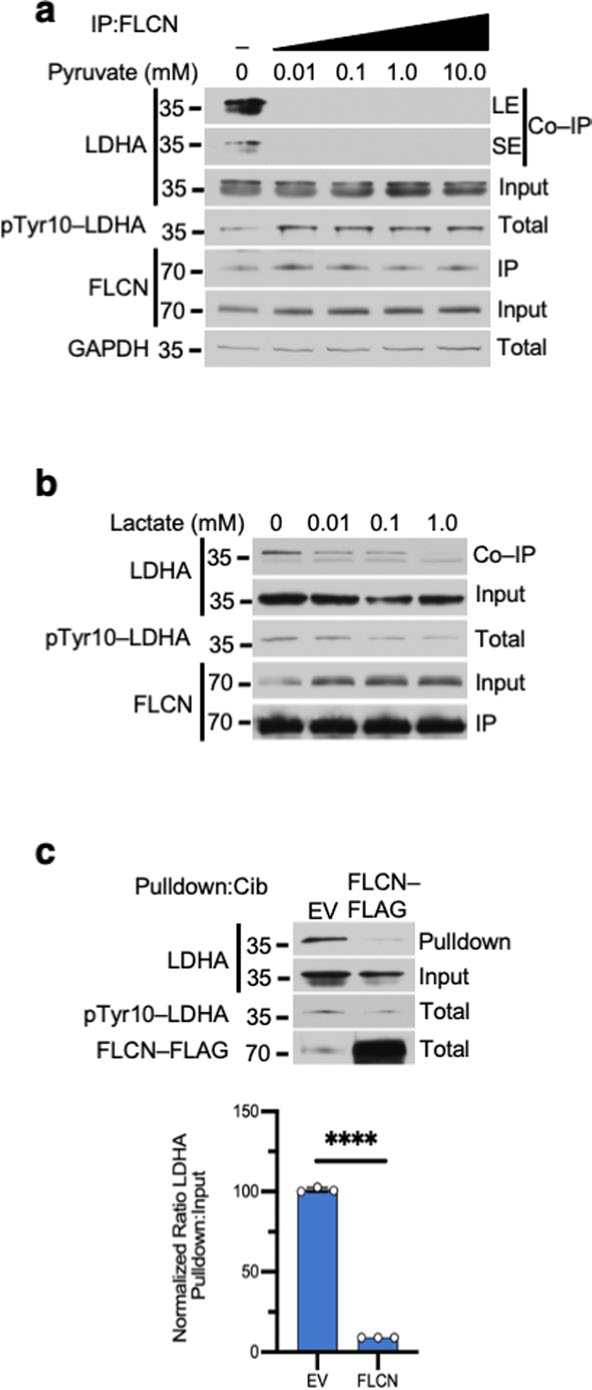
Extended Data Fig. 4 |. FLCN interference with cofactor binding to LDHA.

a) Immunoblot of anti-FLCN IPs and whole cell extracts following exogenous addition of pyruvate to HEK293s (6 h treatment duration; n=3). SE = short exposure of immunoblot, LE = long exposure of immunoblot. b) Immunoblot of anti-FLCN IPs and whole cell extracts following exogenous addition of lactate to HEK293s (6 h treatment durations; n=3). c) Pulldown of LDHA from cell lysate expressing EV or FLCN-FLAG using Cibacron blue agarose was evaluated by immunoblot. Bar chart represents the ratio of Pulldown:Input normalized to EV. Unpaired Student’s t-test, (p < 3.3×10⁻⁸; n=3). Data shown as mean ± s.d.
