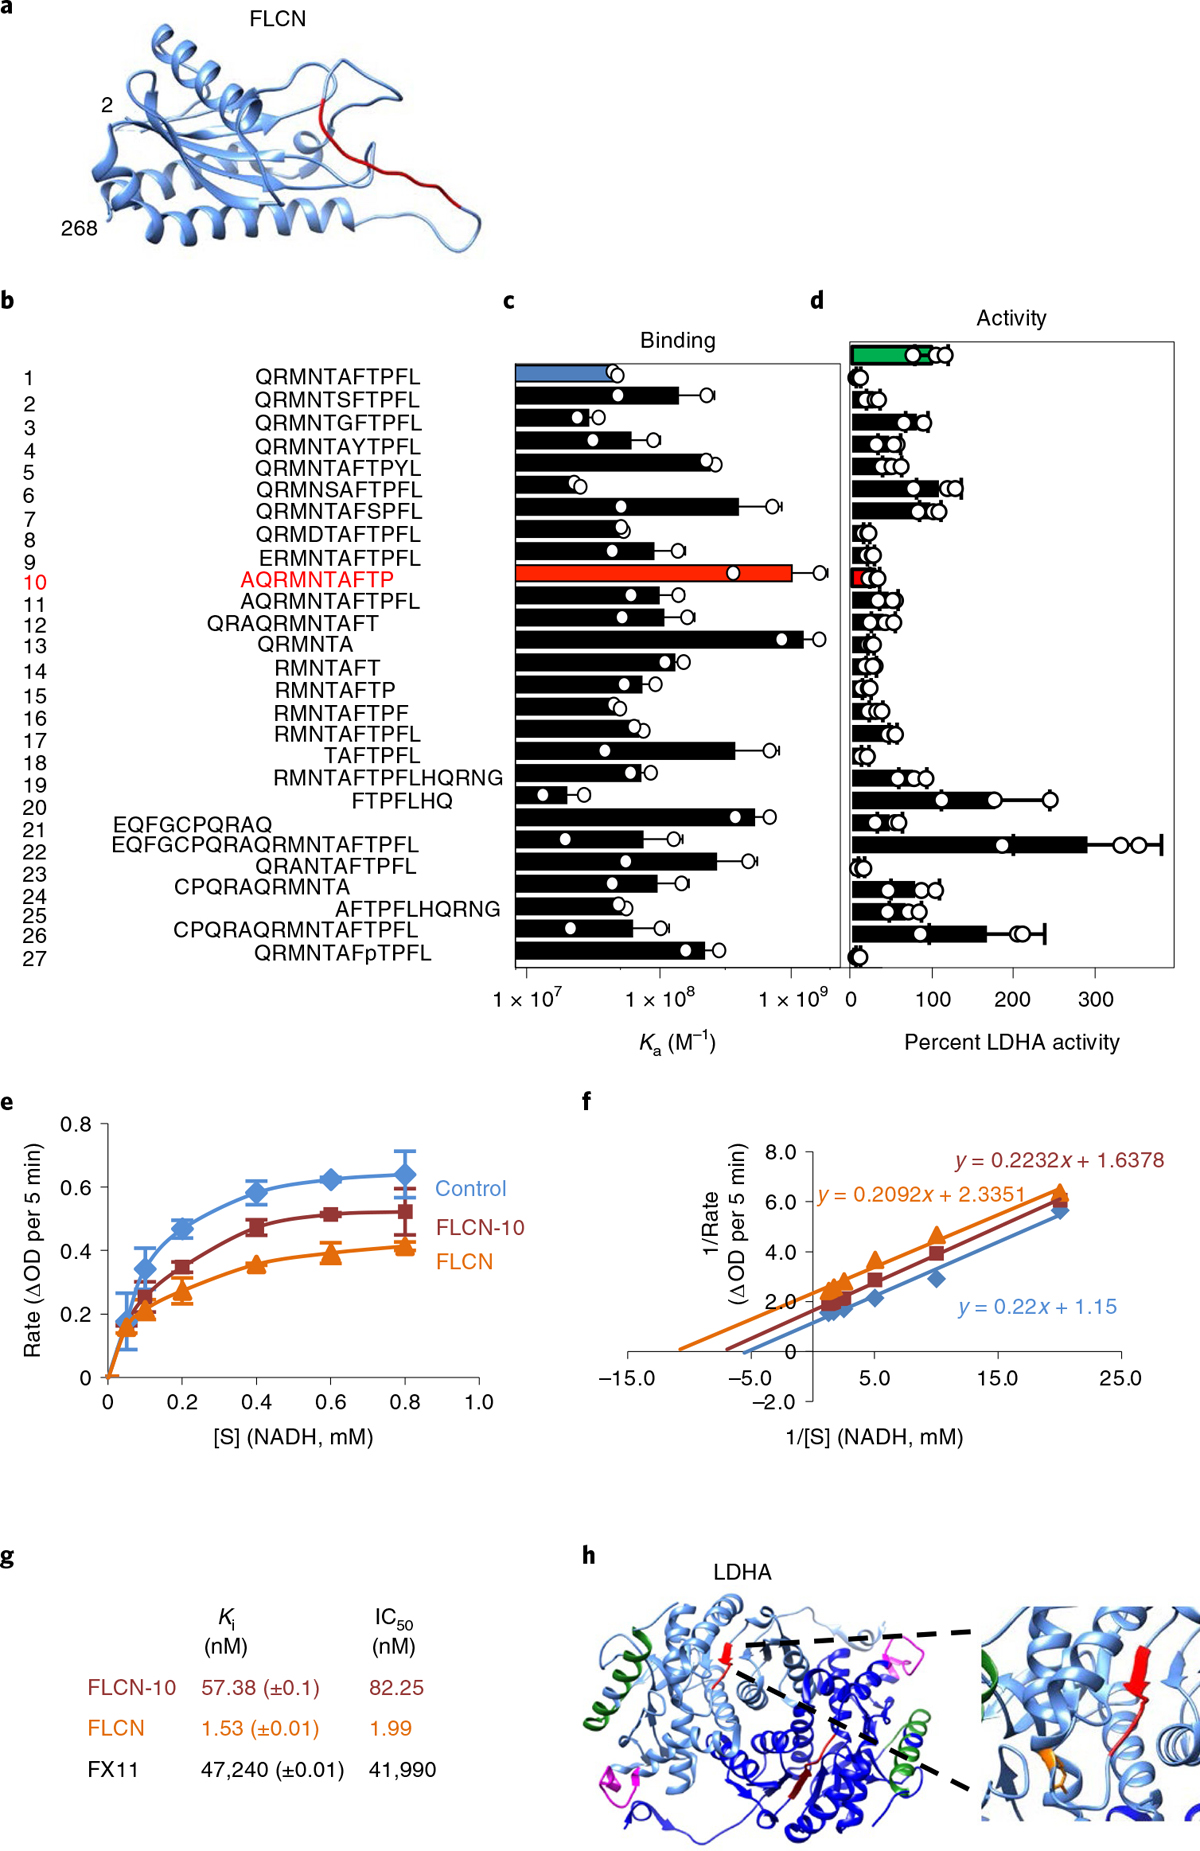
Fig. 2 |. A decameric peptide of FLCN uncompetitively inhibits LDHA.

a, Structure of the FLCN N terminus solved by cryo-EM (aa 2–268; PDB 6NZD). The FLCN-10 peptide is highlighted in red. b–d, List of synthetic FLCN peptides (b) screened for Ka by fluorescence polarization anisotropy (c) or ability to inhibit LDHA (d) in vitro. The green bar represents the activity of LDHA alone (100%). LDHA activity is highlighted in the presence of FLCN-1 (blue) and FLCN-10 (red). Data are presented as mean ± s.d. (n = 3 independent samples). e, Michaelis–Menten kinetics of LDHA activity alone or in the presence of FLCN protein or FLCN-10 peptide. [S] is the concentration of NADH. Data are presented as mean ± s.d. (n = 3 independent samples). f, Enzyme kinetic data presented as a Lineweaver–Burk plot (n = 3 independent samples). g, Measured values for LDHA binding and kinetic data from this figure and Extended Data Fig. 6a–e. h, Structure of dimeric LDHA, with individual monomers colored light or dark blue (PDB 4OKN). Limited proteolysis-coupled mass spectrometry (MS) identified LDHA catalytic-loop-region perturbation (red) and loss of antigenic-loop accessibility (magenta) in response to FLCN-10 peptide binding. The green α-helix represents peptides unchanged by the presence of FLCN-10. The LDHA catalytic R106 is highlighted in orange (inset). Structures were rendered using Chimera v1.12 (UCSF). Source data for c–f are available online.
