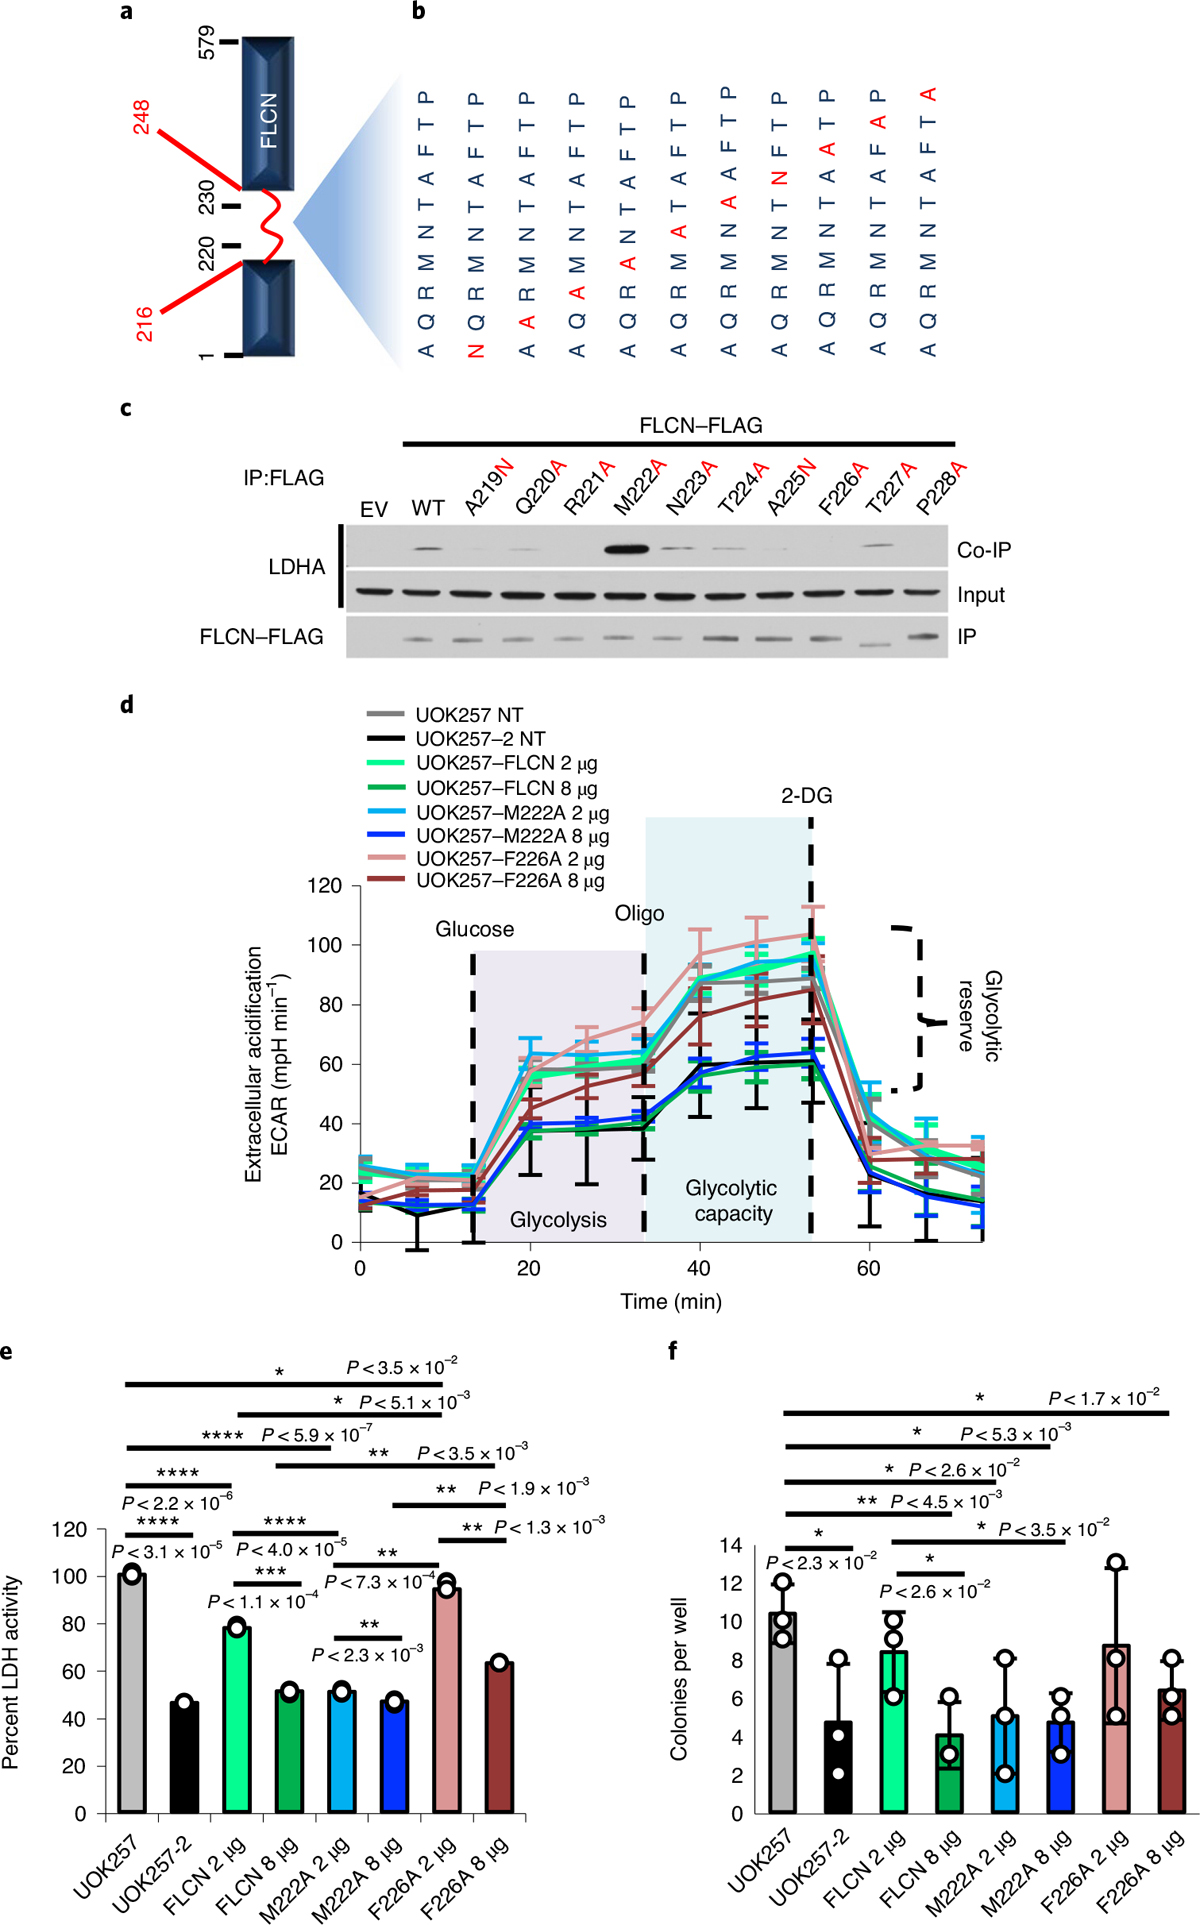
Fig. 3 |. FLCN regulates glycolysis.

a, Schematic of the FLCN protein, highlighting the flexible loop region (red; aa 216–248). b, Individual amino acid mutations in full-length FLCN within the region corresponding to FLCN-10. c, FLAG-tagged FLCN protein harboring point mutations within the FLCN peptide region were transiently expressed in HEK293 cells and immunoprecipitated. The interaction with LDHA (co-IP) was assessed by immunoblot. The blots are a representative example of three independent experiments. d, Extracellular acidification rate of UOK257 cells transfected with 2 μg or 8 μg of WT FLCN, M222A or F226A mutants. Data are presented as mean ± s.d. (n = 8 independent samples). e, LDH activity of lysates collected from samples analyzed in Extended Data Fig. 7a,b. Data are presented as mean ± s.d. (n = 3 independent samples). Asterisks indicate P values based on unpaired Student’s t-test. *P < 0.05; **P < 0.01; ***P < 0.001; ****P < 0.0001. f, Soft agar assay of UOK257 cells expressing indicated FLCN-FLAG. The bar chart shows colonies counted per well. Data are presented as mean ± s.d. (n = 3 independent samples). Asterisks indicate P values based on unpaired Student’s t-test. Source data for c–f are available online.
