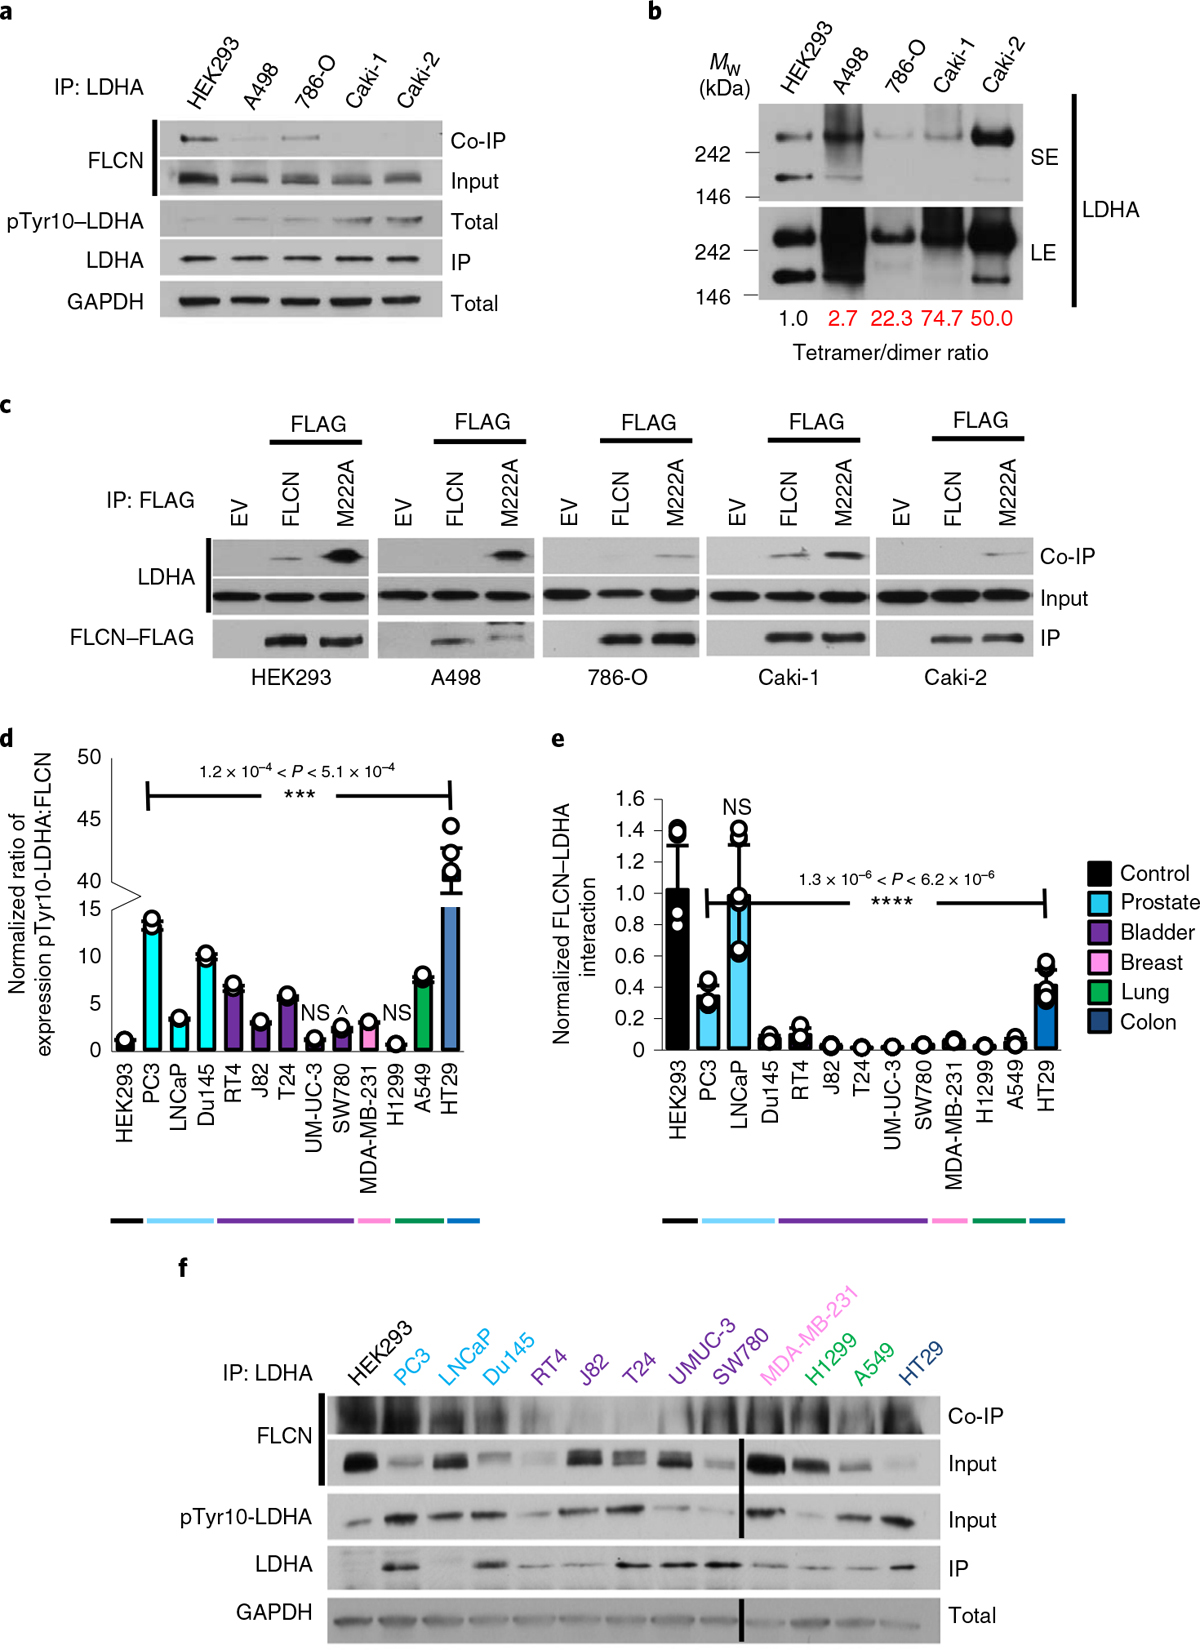
Fig. 4 |. FLCN inhibition of LDHA is commonly lost in cancer.

a, IP of endogenous LDHA with an anti-LDHA antibody from renal cell lines. Interaction with FLCN was observed by immunoblot. The blots are a representative example of three independent experiments. b, Native western blot of renal cell lysate, immunoblotted using anti-LDHA antibody. SE, short exposure; LE, long exposure. The blots are a representative example of three independent experiments. c, IP of WT FLCN and M222A FLCN mutant expressed in renal cell lines. Interaction with LDHA was observed by immunoblot. The blots are a representative example of three independent experiments. d, Densitometric ratio of normalized pTyr10-LDHA:FLCN expression in a panel of cancer cell lines. Data are presented as mean ± s.d. (n = 3 independent samples). P values based on unpaired Student’s t-test: ***P < 0.001; NS, not statistically significant; ^P < 6.9 × 10⁻². e, Normalized FLCN–LDHA interaction from a panel of cancer cell lines. Data are presented as mean ± s.d. (n = 3 independent samples). P values based on unpaired Student’s t-test: ****P < 0.0001. f, Immunoblots of endogenous FLCN and pTyr10-LDHA and interaction of FLCN and LDHA in a panel of cancer cell lines. Source data for all panels are available online.
