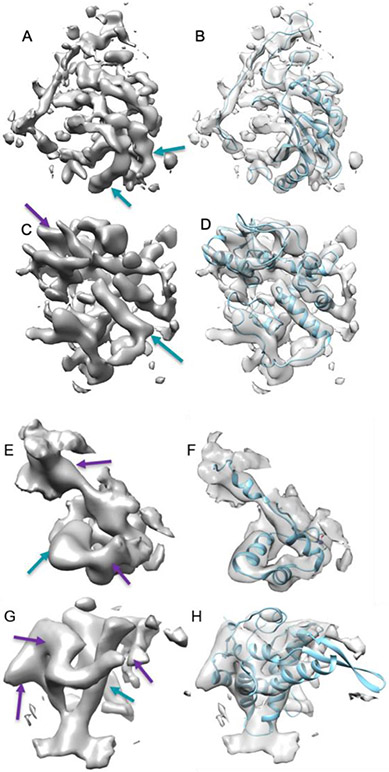
Figure 1. Four samples of cryo-EM density maps at specific chain regions with different quality.
The surface representation of a cryo-EM density map at a specific chain region (left column) and its atomic model (right column, blue ribbon) is shown for each sample. (A, B) High-quality bin: EMD-4041, chain C of 5LDX (PDB ID); (C, D) Medium-high quality bin: EMD-1657, chain AD of 4V5H (PDB ID); (E, F) Low-quality bin: EMD-8737, chain J of 5VVS (PDB ID); (G, H) Poor-quality bin: EMD-5327, chain T of 3JO0 (PDB ID). Blue arrows (better) and purple arrows point to density regions of helices with varying quality of the map.

