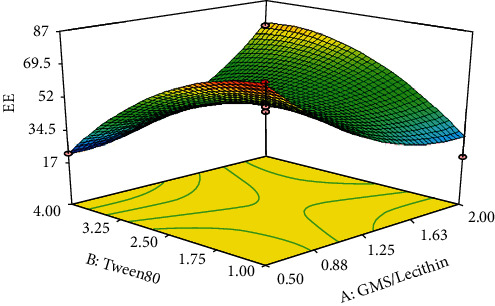
Figure 5.

Response 3D plots for alteration in the EE% values. In the lowest concentration of Tween 80 (i.e., 1%), the values for EE% fell dramatically by increasing the concentration ratio of GMS/lecithin from 0.5 to 1.25%. Further increase in the concentration ratio up to 2.0 resulted in a slight and nonsignificant reduction in the EE%. On the other hand, in the highest concentration of Tween 80 (i.e., 4.0), the values for EE% of the nanoparticles were increased by increasing the concentration ratio.
