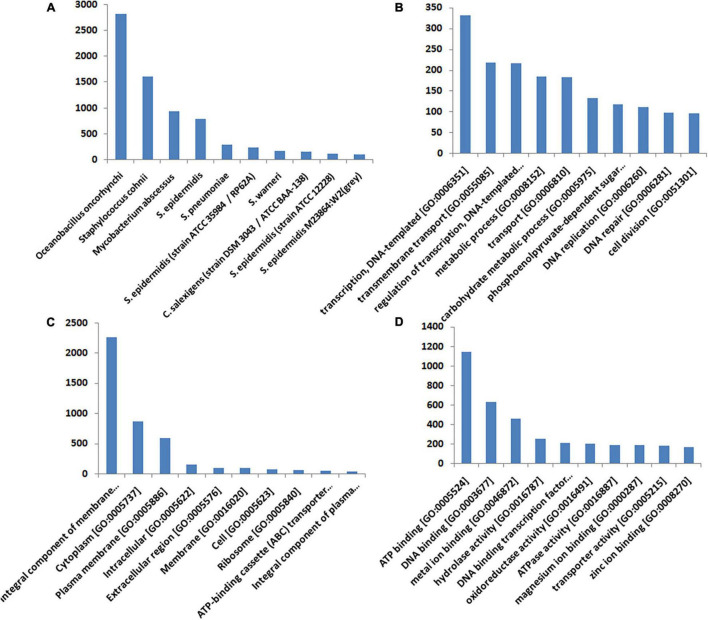
FIGURE 4.
Annotation and the gene ontology of DEGs. The assembled transcripts were compared with the UniProt database using the BLASTX program with an E-value cutoff of 10– 3. The best BLASTX hit based on query coverage, identity, similarity score, and description of each transcript was filtered out using an in-house pipeline. Based on the BLASTX summary and E-value and similarity score distribution of BLASTX hits, the annotation was done. (A) Shows the distribution of the top 10 organisms corresponding to the best BLASTX hits. (B–D) Represent the top 10 categories of each gene ontology (GO) in terms of molecular function, cellular component, and biological process, respectively. The transcripts were also mapped against the latest GO database.

