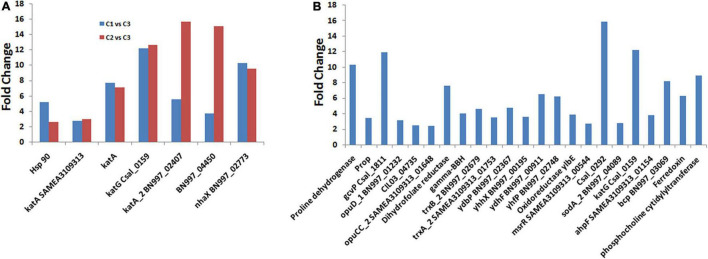
FIGURE 5.
Differentially expressed genes (DEGs) involved in adaption to osmotic and oxidative stress. (A) Represents the comparison of the fold change in some of the transcripts involved in salt stress between the C1 vs. C3 and C2 vs. C3, and (B) represents the fold change of the DEGs involved in osmotic and oxidative stress conditions.

