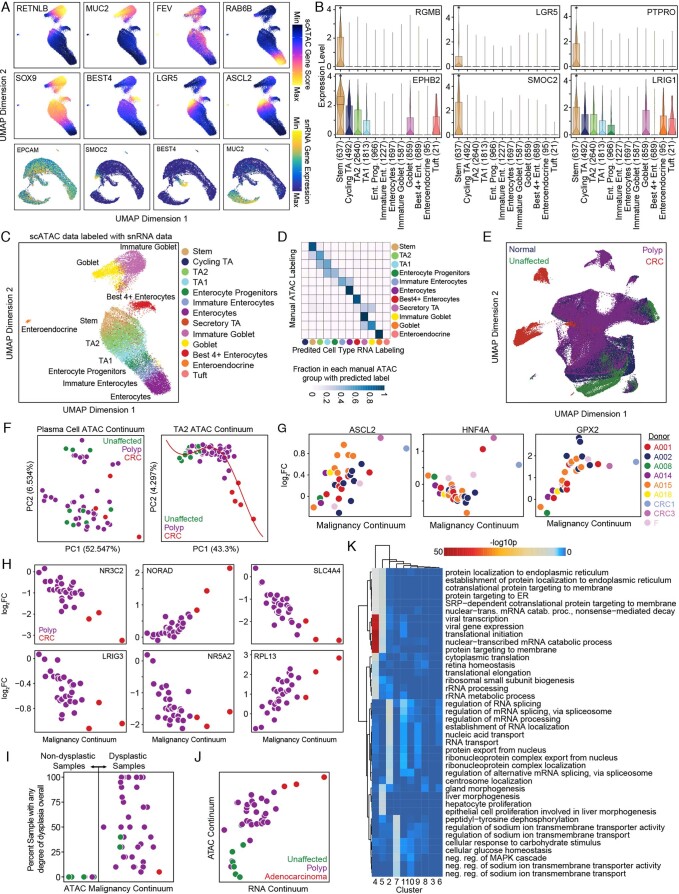
Extended Data Fig. 6. Characterization of normal colon epithelium and identification of changes along the malignancy continuum.
(a) Upper 8 panels: UMAP projection of normal colon epithelial cells colored by scATAC gene activity scores of the epithelial marker genes RETNLB (immature goblet), MUC2 (goblet), FEV (enteroendocrine), RAB6B (enterocyte), SOX9 (stem), BEST4 (Best4+ enterocyte), LGR5 (stem), and ASCL2 (stem). Lower 4 panels: UMAP projection of normal colon epithelial cells colored by expression of marker genes EPCAM (general epithelial), SMOC2 (stem), BEST4, and MUC2. (b) Violin and boxplot representation of gene expression of stem marker genes by epithelial cell type. Asterisks indicate that gene expression is significantly upregulated when compared to all other cell types. Boxplots represent the median, 25th percentile, and 75th percentile of the data and whiskers represent the highest and lowest values within 1.5 times the interquartile range of the boxplots. (c) Labeling of scATAC-seq epithelial cells by nearest snRNA-seq cells following integration of the datasets with CCA. (d) Confusion matrix comparing annotation of scATAC cells using marker genes and labeling of scATAC cells with the nearest snRNA-seq cell following integration of scATAC and snRNA-seq datasets. (e) UMAP representation of snRNA-seq epithelial cells colored by disease state. (f) Results of computing the continuum on plasma cells and TA2 cells using the same method performed for stem cells. (g) Log2FC in expression of ASCL2, HNF4A, and GPX2 in stem-like cells from each sample relative to stem-like cells in unaffected samples plotted against the malignancy continuum defined in 4D. Samples are colored based on the patient the sample was collected from. (H) Log2FC in expression of NR3C2, NORAD, SLC4A4, LRIG3, NR5A2, and RPL13 as a function of malignancy continuum. Samples are colored based on if they are derived from polyps or CRCs. (i) Relationship between the malignancy continuum and percent of sample with any degree of dysplasia as determined by microscopic pathology. Samples are colored based on gross classification as a polyp (purple) or unaffected (green) tissue. Note that some samples classified as unaffected had dysplasia while some samples classified as polyps did not have dysplasia. (i) Relationship between the malignancy continuums defined from the scATAC and snRNA-seq datasets. Samples are colored based on gross classification as unaffected, polyp, or CRC. (k) Enrichment of gene ontology terms in clusters of differential RNA genes in Fig. 4.

