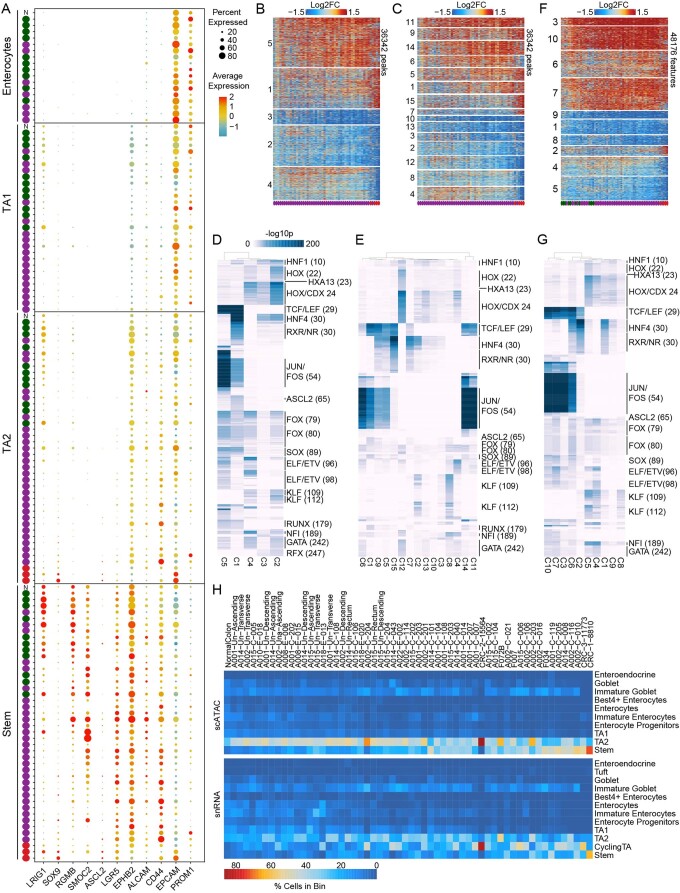
Extended Data Fig. 7. Motif enrichment in differential peaks with different numbers of k-means clusters.
(a) Expression of intestinal stem cell and colon cancer stem cell marker genes in stem cells, TA2 cells, TA1 cells, and Enterocytes by sample. Samples are ordered by the malignancy continuum defined in Fig. 4. (B, c) Heatmaps of all peaks that were significantly differentially accessible (Wilcoxon test, padj≤0.05 & |log2FC | ≥1.5) in ≥2 samples. Samples are ordered along the x-axis by the malignancy continuum defined in Fig. 4. Peaks are k-means clustered into 5 (b) or 15 (c) clusters. (d, e) Hypergeometric enrichment of TF motifs in k-means clusters of peaks defined in B (d) and C (e). (f) Heatmap of all peaks that were significantly differentially accessible in ≥2 samples between stem cells from a given sample and normal colon stem cells. Samples are ordered along the x-axis by the malignancy continuum defined in Fig. 4. Peaks are k-means clustered into 10 groups. (g) Hypergeometric enrichment of TF motifs in k-means clusters of peaks defined in F. (h) Heatmap representation of cell types in each epithelial sample as determined by the nearest normal cell after projecting the cells into the normal LSI subspace.

