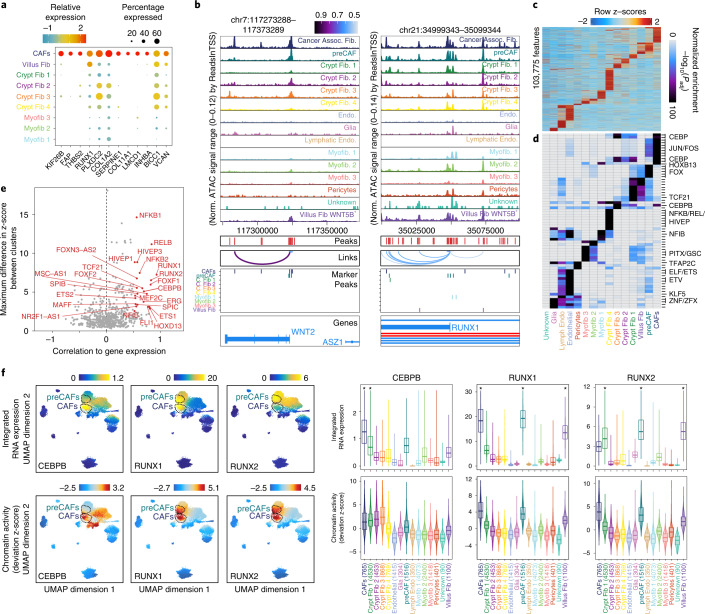
Fig. 2. Epigenetic regulators of preCAFs and CAFs.
a, Dot plot representation of significant (MAST test) marker genes for CAFs. b, Genomic tracks for accessibility around WNT2 and RUNX1 for different stromal cell types. Peaks called in the scATAC data and peaks-to-gene links are indicated below the tracks. For example, a regulatory element ~50 kb away from the WNT2 TSS that is most accessible in CAFs whose accessibility is highly correlated to gene expression of WNT2 is indicated below the tracks. Marker peaks (Wilcoxon FDR ≤ 0.1 and log2FC ≥ 1.0) for each fibroblast subtype are indicated below the tracks. c, Marker peaks (Wilcoxon FDR ≤ 0.1 and log2FC ≥ 0.5) for each stromal cell type. Significance is determined by comparing each cell type with a background of all other cell types. d, Hypergeometric enrichment of TF motifs in stromal cell marker peaks. e, Plot of maximum difference between chromVAR deviation z-score, depicting TF motif activity, against correlation of chromVAR deviation and corresponding TF expression. TFs with maximum differences in chromVAR deviation z-score in the top quartile of all TFs and a correlation of greater than 0.5 are indicated in red. f, RNA expression (top) and chromVAR deviation z-scores (bottom) for selected TFs. The RNA expression plotted is the expression in the nearest RNA cell following integration of the snRNA-seq and scATAC-seq data. Corresponding violin plots and boxplots quantifying integrated gene expression and chromVar deviation z-scores for cells in each cell type are shown at the right. Boxplots represent the median, 25th percentile and 75th percentile of the data, and whiskers represent the highest and lowest values within 1.5 times the interquartile range of the boxplot. Cell types with significantly higher (Wilcoxon test, FDR ≤ 0.01 and log2FC ≥ 1) integrated RNA expression when compared with all other cell types are indicated with an asterisk. Assoc., associated; C. Fib, crypt fibroblast; Endo., endothelial; Norm., normalized.

