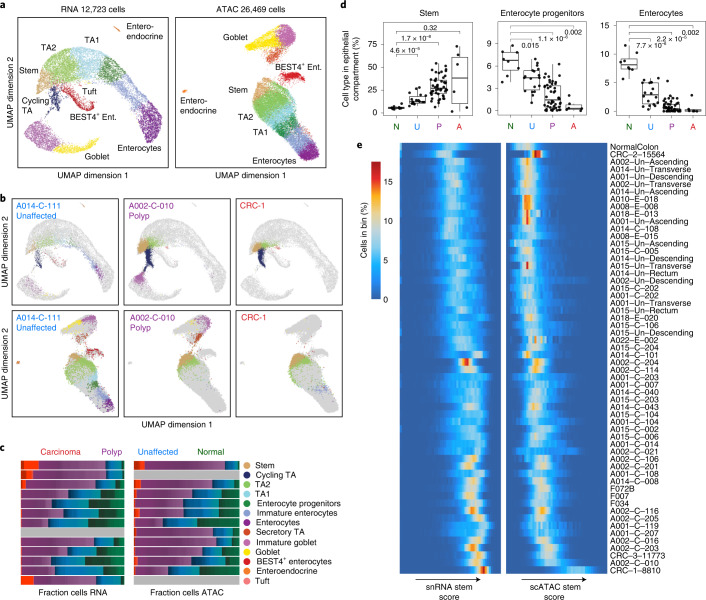
Fig. 3. Stem-like features observed in epithelial cells.
a, UMAP projection of snRNA-seq (left) and scATAC-seq (right) epithelial cells isolated from normal colon with cells colored by cell type. Colors for the cell types are defined in c. b, Projection of epithelial snRNA-seq (top) and scATAC-seq (bottom) cells from unaffected (left), polyp (center) and CRC (right) samples into the manifold of normal colon epithelial cells. Projected cells are colored by nearest normal cells in the projection and normal epithelial cells are colored gray. c, Fraction of each epithelial cell type isolated from normal (green), unaffected (blue), polyp (purple) and CRC (red) samples. Cell types are defined based on the identity of the nearest cell types when projecting epithelial cells into normal colon subspace. d, Boxplots depicting the fraction of cells within the epithelial compartment that are stem-like cells, enterocyte progenitors or enterocytes, divided by disease state. Abundances of each cell type in unaffected, polyp and CRC tissues are compared with their abundances in normal tissues with two-sided Wilcoxon testing and Bonferroni correction for multiple comparisons, and the resulting adjusted P values are listed in the plots. The boxplots are constructed with data from 8 normal samples, 18 unaffected samples, 48 polyp samples and 6 CRC samples. Boxplots represent the median, 25th percentile and 75th percentile of the data; whiskers represent the highest and lowest values within 1.5 times the interquartile range of the boxplot; and all points are plotted. e, Distribution of snRNA-seq and scATAC-seq stem scores in all epithelial cells in each sample. The rows represent individual samples and the columns represent 50 bins of stem scores from low to high for RNA (left) and ATAC (right). The heatmap is colored by the percentage of epithelial cells in each sample that are in a given bin of stem scores. A, adenocarcinoma; Ent., enterocyte; N, normal; P, polyp; TA, transit amplifying; U, unaffected FAP.

