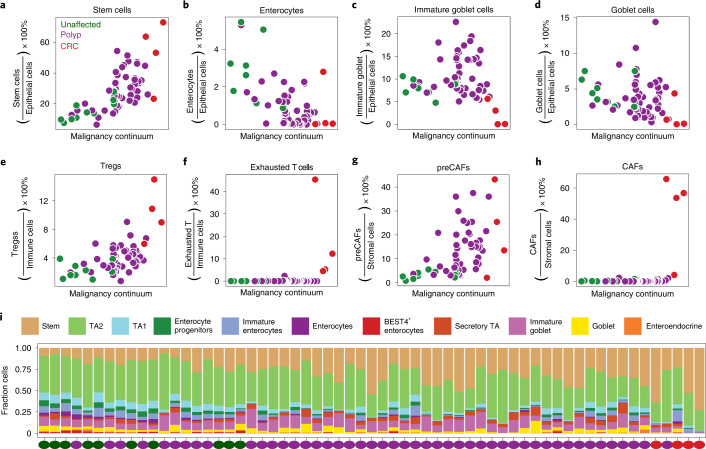
Fig. 5. Dynamics of cell-type representation in malignant transformation.
a–h, Fraction of cell type in each scATAC sample plotted against position of the sample in the malignancy continuum defined in Fig. 4d for stem-like cells (a), enterocytes (b), immature goblet cells (c), goblet cells (d), Tregs (e), exhausted T cells (f), preCAFs (g) and CAFs (h). Samples are colored based on if they are derived from unaffected tissues, polyps or CRCs. Fractions are computed by dividing the number of cells of a given cell type by the total number of cells in the compartment (epithelial versus immune versus stromal). i, Stacked boxplot representation of the fraction of epithelial cells of each cell type for each scATAC sample along the malignancy continuum.

