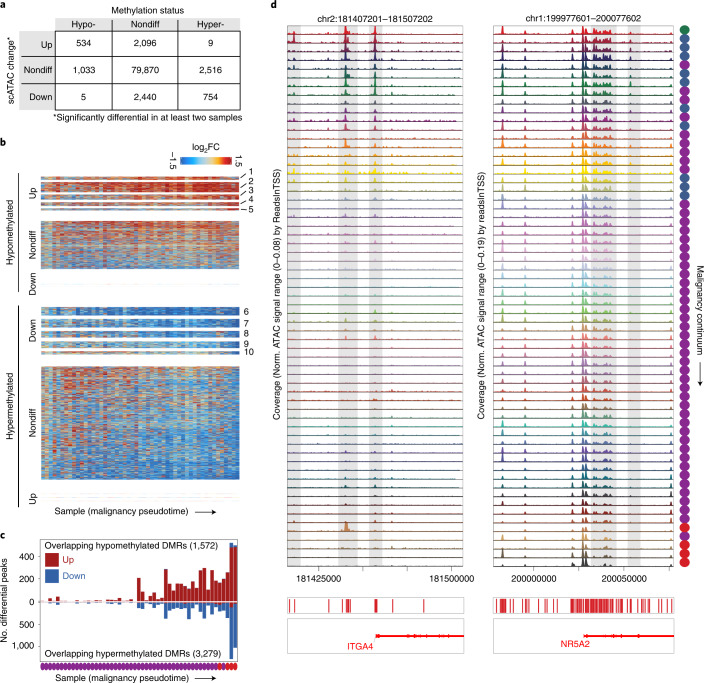
Fig. 6. Integration of single-cell colon data with CRC methylation data reveals CRC DMRs with early changes in chromatin accessibility.
a, Table relating the change in accessibility for peaks to the methylation status of Illumina 450K methylation probes they overlap. In total, ~89,000 peaks overlapped 180,000 450K probes. Peaks classified as up were members of clusters 1–5 in Fig. 4f and peaks classified as down were members of clusters 6–10 in Fig. 4f. b, Heatmaps of peaks overlapping hypomethylated (top) and hypermethylated (bottom) 450K probes in CRC. The heatmaps are split into peaks from more accessible and less accessible groups defined in Fig. 4h and peaks not included in Fig. 4h. For nondifferential (nondiff) peaks overlapping hypermethylated probes, and sign test P < 10−50. For nondifferential peaks overlapping hypomethylated peaks, and sign test P < 10−50. c, Number of significantly differential peaks overlapping hypomethylated or hypermethylated 450K probes for each sample. The total number of peaks overlapping hypermethylated and hypomethylated probes is listed in each plot. d, Accessibility tracks around ITGA4 and NR5A2, which are hypermethylated in CRC. Tracks are ordered by position of the corresponding sample in the malignancy continuum defined in Fig. 4. DMR, differentially methylated region.

