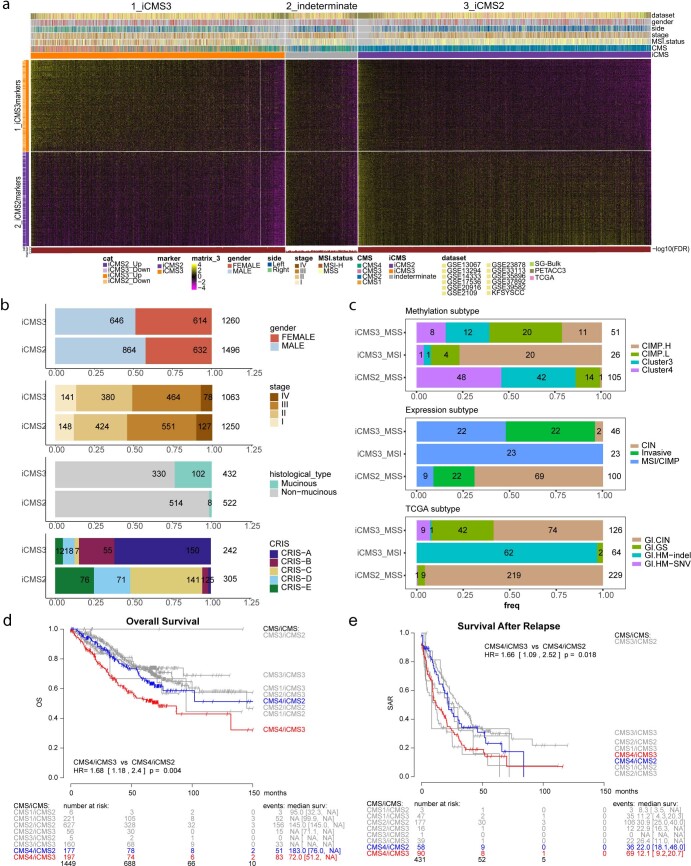
Extended Data Fig. 4. iCMS classification in 15 bulk datasets.
a. Heatmap of 715 iCMS genes used to classify 3,614 samples across 15 datasets by NTP, colored by scaled gene expression, arranged by sum of expression of signature genes. Top annotation bars show clinical information for each sample (dataset, gender, side, stage, MSI status, CMS, iCMS). Bottom annotation shows the FDR of NTP classification. b. Proportions of gender, stage, histological type and CRIS subgroup from 15 bulk datasets; number of samples in each group is labelled. For each analysis, only samples with information available were used. c. Proportions of methylation subtype (n = 182, top, as defined in the original paper1), expression subtype (n = 169, middle) and TCGA subtype (n = 419, bottom) in iCMS2_MSS, iCMS3_MSS and iCMS3_MSI from TCGA; number of samples in each group is labelled. (d,e) Kaplan-Meier plot of overall survival (d) and survival after relapse (e) for all patients classified by CMS and iCMS.

