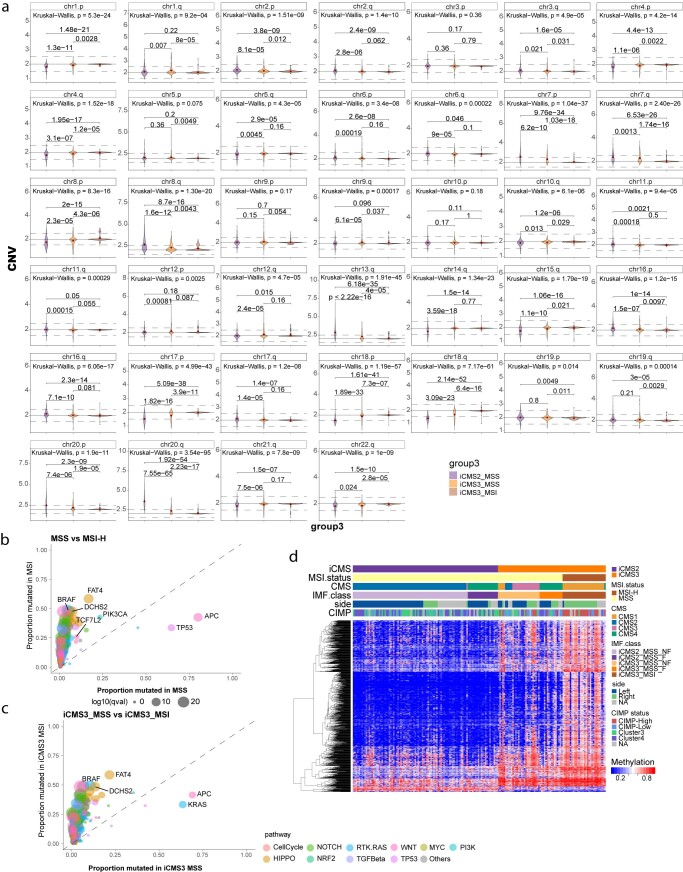
Extended Data Fig. 5. Genomic features in iCMS, MSI, and CIMP status.
a. Log2 copy-number ratios for each chromosome arm in iCMS2_MSS (n = 363), iCMS3_MSS (n = 189) and iCMS3_MSI (n = 107) from TCGA and SG-Bulk datasets. P-values for pairwise comparisons are by two-sided Wilcoxon rank-sum test; overall p-value is by Kruskal-Wallis test. Scatterplot of proportion of TCGA and SG-Bulk samples with mutations in 333 CRC-associated genes, in b. MSS (n = 519) vs MSI (n = 101) and c. iCMS3_MSS (n = 181) vs iCMS3_MSI (n = 99) (right). Dot size corresponds to q-value by Fisher’s exact test with Benjamini-Hochberg correction. Only genes with q-value <0.05 and proportion mutated > 0.5 are labelled. (d) Heatmap of differentially methylated CpG sites (n = 978) between iCMS2 and iCMS3 subtypes in 176 TCGA samples.

