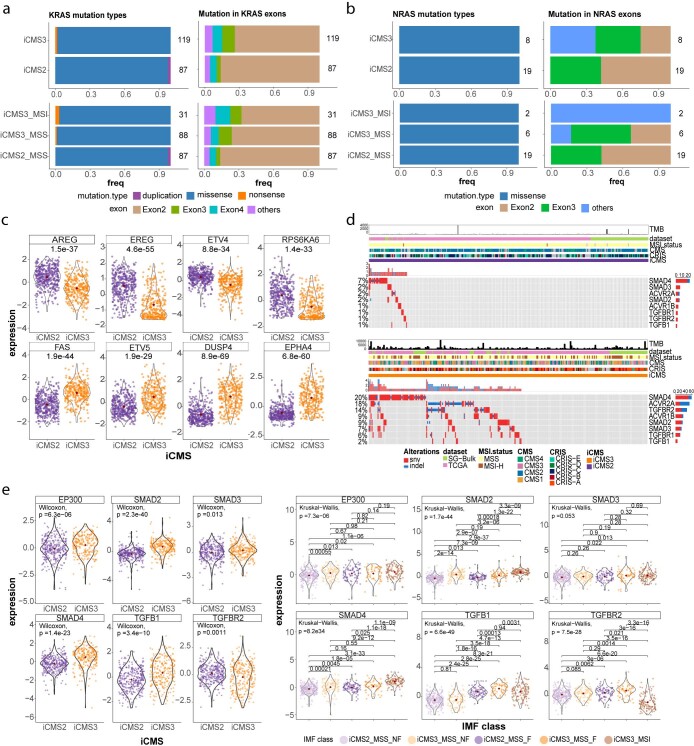
Extended Data Fig. 7. MAPK and TGF-beta pathways in iCMS.
Proportion of mutation types and locations in a. KRAS (n = 206) and b. NRAS (n = 27) in samples with KRAS/NRAS mutations from TCGA and SG-Bulk data; number of samples in each group is labelled. Comparisons are between iCMS2/iCMS3 (top), and iCMS2_MSS/iCMS3_MSS/iCMS3_MSI (bottom). c. Scaled gene expression of selected MAPK pathway genes in iCMS2 (n = 396) and iCMS3 (n = 312), from TCGA and SG-Bulk datasets. P-values shown are by two-sided Wilcoxon rank-sum test without correction. d. Mutational landscape of selected TGF-beta pathway genes in iCMS2 (top, n = 344) and iCMS3 (bottom, n = 281) samples in TCGA and SG-Bulk datasets. e. Scaled gene expression of selected TGF-beta pathway genes iCMS2 (n = 396) and iCMS3 (n = 312) (left) and across the IMF 5 categories: i2_MSS (n = 240), i2_fibrotic (n = 82), i3_MSS (n = 92), i3_fibrotic (n = 58), i3_MSI (n = 105) (right). P-values are calculated using two-sided Wilcoxon rank-sum test without correction.

