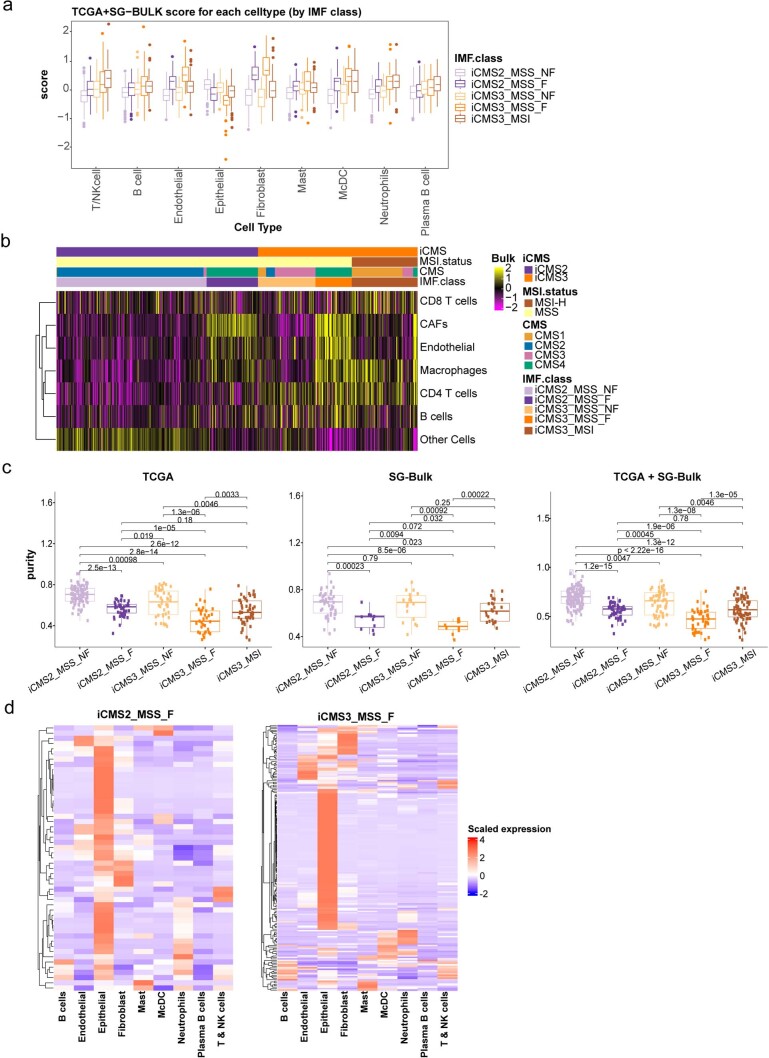
Extended Data Fig. 8. Tumor microenvironment in IMF classes.
a. Boxplot of the average scaled gene expression of cell type-specific signatures of the 9 major cell types in 577 bulk samples from TCGA and SG-Bulk datasets, split by IMF. Center line indicate the median, and box edges indicate the 25th (Q1) and 75th (Q3) percentiles. Whiskers are plotted at 1.5xIQR and data beyond the end of the whisker are outliers. b. Heatmap of the EPIC cell fractions across the major cell types in TCGA and SG-Bulk datasets (n = 577). EPIC was performed on these datasets using the in-house cell type categories and reference panel2. EPIC scores were log-transformed, zero-centered and scaled to unit variance. Columns are patients ordered by IMF, and rows are cell types ordered by unsupervised hierarchical clustering. c. Tumor purity estimate of samples from TCGA (left), SG-Bulk (middle) and TCGA + SG-Bulk (right), split by IMF. TCGA: iCMS2_MSS (n = 96), iCMS2_fibrotic (n = 44), iCMS3_MSS (n = 42), iCMS3_fibrotic (n = 33), iCMS3_MSI (n = 49). SG-Bulk: iCMS2_MSS (n = 51), iCMS2_fibrotic (n = 11), iCMS3_MSS (n = 18), iCMS3_fibrotic (n = 10), iCMS3_MSI (n = 25). TCGA + SG-Bulk: iCMS2_MSS (n = 147), iCMS2_fibrotic (n = 55), iCMS3_MSS (n = 60), iCMS3_fibrotic (n = 43), iCMS3_MSI (n = 74). P-values are by two-sided Wilcoxon rank-sum test without correction. Center line indicate the median, and box edges indicate the 25th (Q1) and 75th (Q3) percentiles. Whiskers are plotted at 1.5xIQR and data beyond the end of the whisker are outliers. d. Mapping of differentially expressed genes between iCMS2_MSS_F and iCMS3_MSS_F onto CRC-SG1 pseudobulk expression matrix by cell type. The heatmap on the left shows genes upregulated in iCMS2_MSS_F compared to iCMS3_MSS_F, while the heatmap on the right shows genes upregulated in iCMS3_MSS_F compared to iCMS2_MSS_F.

