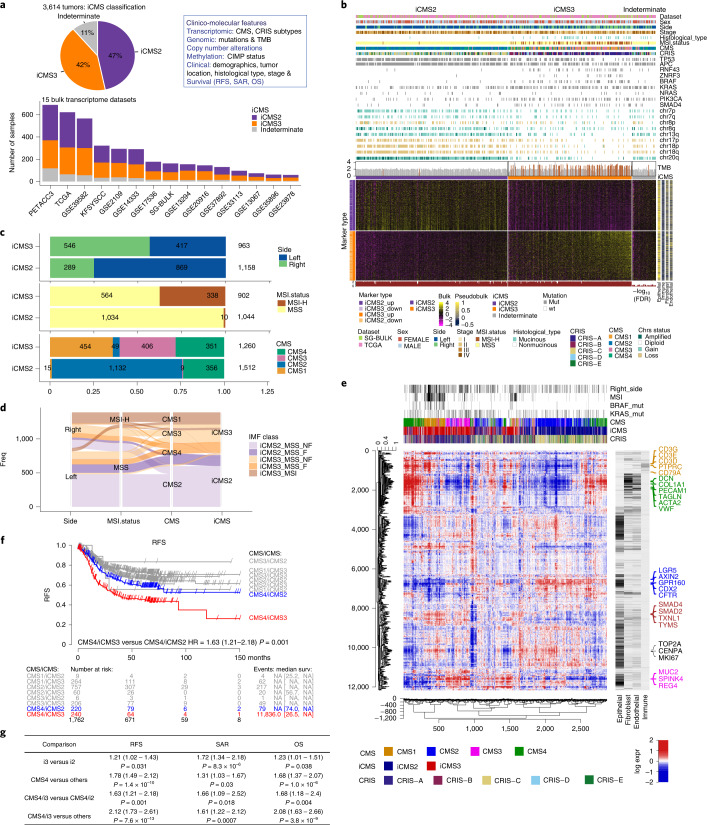
Fig. 3. iCMS classification of bulk transcriptomes.
a, Proportion of 3,614 patients classified as iCMS2, iCMS3 or indeterminate based on their bulk tumor transcriptome. The box on the right lists the parameters that will be correlated with iCMS, including: CMS, CRIS, CIMP, TMB and copy number variation, overall survival (OS), survival after relapse (SAR) and RFS. b, Heatmap of 715 iCMS marker genes used to classify the 455 TCGA and SG-Bulk tumor transcriptomes. Gene expression values were log-transformed, zero-centered and scaled to unit variance. Upper annotation bars show clinical, mutational and copy number gain/loss categorized as amplified (≥4 copies), gain (2.5–4 copies), diploid (1.5–2.5 copies) and loss (<1.5 copies), as well as TMB (MSI-H patients highlighted in brown). Right annotation bar shows the average scaled expression of each gene across four major cell types, based on scRNA-seq data from the CRC-SG1 cohort. Lower annotation track: FDR Q value of iCMS classification. c, Breakdown of iCMS2 and iCMS3 samples by anatomical side (top), MSI status (middle) and CMS (bottom). Statistics are based on all bulk tumor datasets, including only those for which the relevant annotations are available. d, Bulk tumor datasets: alluvial plot demonstrating the relationship between IMF classification and anatomical side, MSI status, CMS subtype and iCMS. e, Heatmap showing the coexpression pattern of 2,873 bulk tumor transcriptomes from 14 clinical cohorts. Rows are genes; columns are patients; ordering is by unsupervised hierarchical clustering. Gene expression values are normalized as in b. CMS, iCMS and CRIS labels are indicated above the map, together with selected clinical parameters. Annotation bars for four major tumor cell types are as in b. f, Kaplan–Meier plot of RFS of patients classified by CMS and iCMS. The table below the graph indicates the number of patients at risk for all groups at various time points, followed by the number of events and median survival (in months) with their confidence intervals. g, Summary table of survival analysis conducted in this study. P values are Cox proportional hazard models (as implemented by R survival package). FDR, False Discovery Rate.

