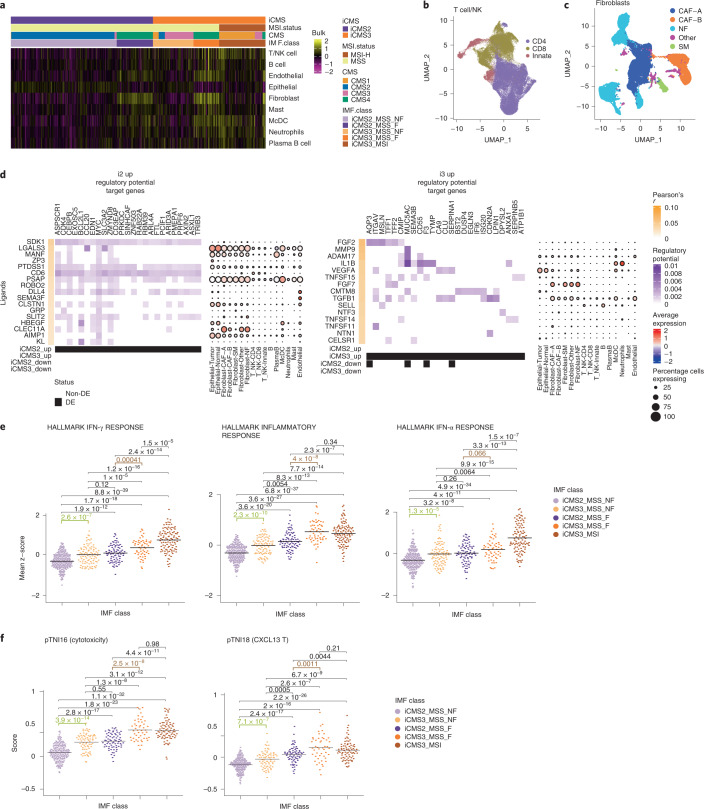
Fig. 6. Epithelial cell interactions with microenvironment.
a, Heatmap of the average scaled gene expression of cell-type-specific signatures of the nine major cell types in 577 bulk samples from TCGA and SG-Bulk datasets. b,c, UMAP of T cells (b) (n = 76,812 cells) and fibroblasts (c) (n = 31,451 cells) from 14 patients in CRC-SG1 dataset, colored by subtypes, used in signaling analyses. d, NicheNet analysis using i2 up gene set (left) and i3 up gene set (right). The heatmap depicts the regulatory potential scores (purple) for the top 200 target genes of each of the top 20 ligands ranked by Pearson correlation (orange) after filtering at a quantile cutoff of 0.33 for the regulatory potential score. The dotplot on the right depicts the average scaled patient-wise pseudo-bulk expression of each of the top-ranked ligands in each cell type across patients in the CRC-SG1 cohort. Dot size corresponds to the percentage of cells expressing the ligand in each cell type. e, Metascores for top three inflammation-related pathways identified by GSEA, in 577 bulk samples from TCGA and SG-Bulk, split by IMF: i2_MSS (n = 240), i2_fibrotic (n = 82), i3_MSS (n = 92), i3_fibrotic (n = 58), i3_MSI (n = 105). f, CXCL13 and cytotoxicity gene program scores (from Pelka et al. 13) in 462 bulk samples from TCGA, split by IMF: i2_MSS (n = 189), i2_fibrotic (n = 71), i3_MSS (n = 74), i3_fibrotic (n = 48), i3_MSI (n = 80). In e and f, P values are by two-sided Wilcoxon rank-sum test without adjustment of multiple comparison. DE, Differentially expressed; SM, Smooth Muscle.

