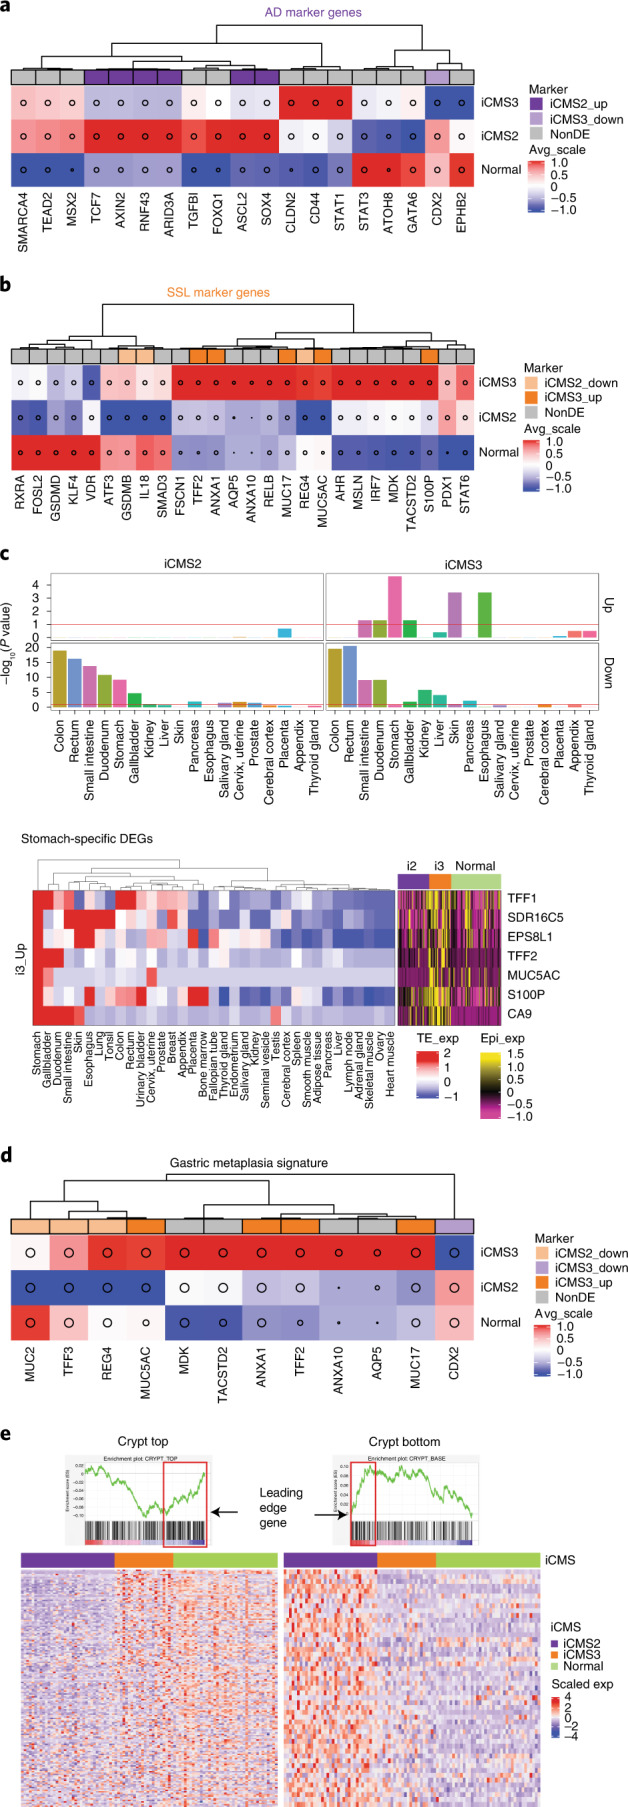
Fig. 7. Association of iCMS markers with polyp subtypes and normal tissues.

a,b, Heatmaps of tubular adenoma (AD) (a) and SSL (b) marker genes obtained from Chen et al. 44, colored by the average of scaled (z-transformed) expression values of epithelial single cells from five-cohort scRNA-seq data (patients = 61). c, Barplots quantify enrichment of tissue-specific genes in each of the four DEG sets, calculated using the TissueEnrich package (iCMS2 Up: 308; iCMS2 Down: 279; iCMS3 Up: 74; iCMS3 down: 54; total: 715). Red line, P = 0.1. The heatmaps show expression levels of the seven iCMS3-Up DEGs defined as stomach-specific in the TissueEnrich database. Left, scaled expression in diverse tissues. Right, scaled epithelial pseudo-bulk expression in 61 patients. d, Heatmap of gastric metaplasia signature genes, similar to a and b. e, Heatmap of GSEA leading edge genes within crypt top and crypt bottom gene sets, showing scaled epithelial pseudo-bulk expression levels across 61 patients from five scRNA-seq cohorts.
