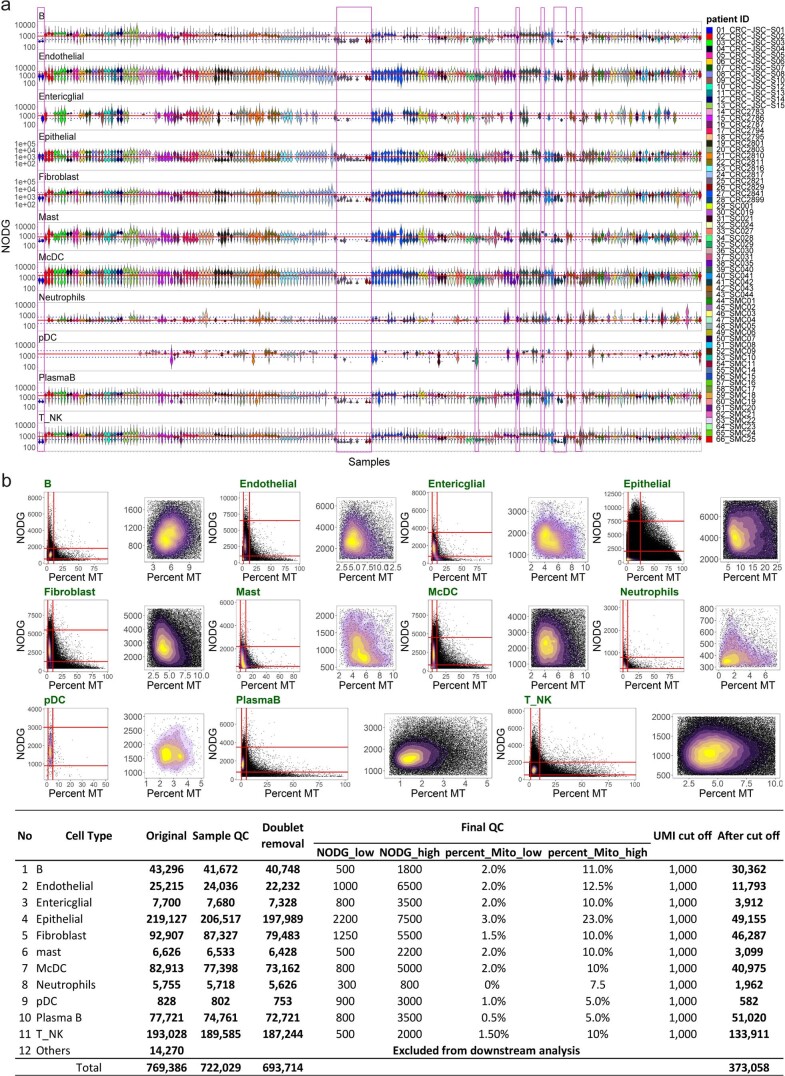
Extended Data Fig. 1. QC cut off for all cells in 5 cohorts.
Violin plot showing number of detected genes (NODG) distribution of each sample in their respective cell types. Solid red lines indicate median NODG across 211 samples in each respective cell type, while dashed blue lines indicate 2 or 0.5 times the red line. Magenta box highlight samples with median NODG consistently higher or lower than the dashed blue lines in more than half of the cell types, which were discarded from this study (22 samples from 9 patients). b. Density plot and numeric table for all cell types in 5 cohorts before and after quality control (QC). Red lines in the density plots indicate the QC parameter that was used. The 11 major cell types are: B cells (B), Endothelial cells, Epithelial cells, Fibroblast cells, Granulocyte cells, monocyte conventional dendritic cell (McDC), Plasma-B cells, T and NK cells (T_NK).

