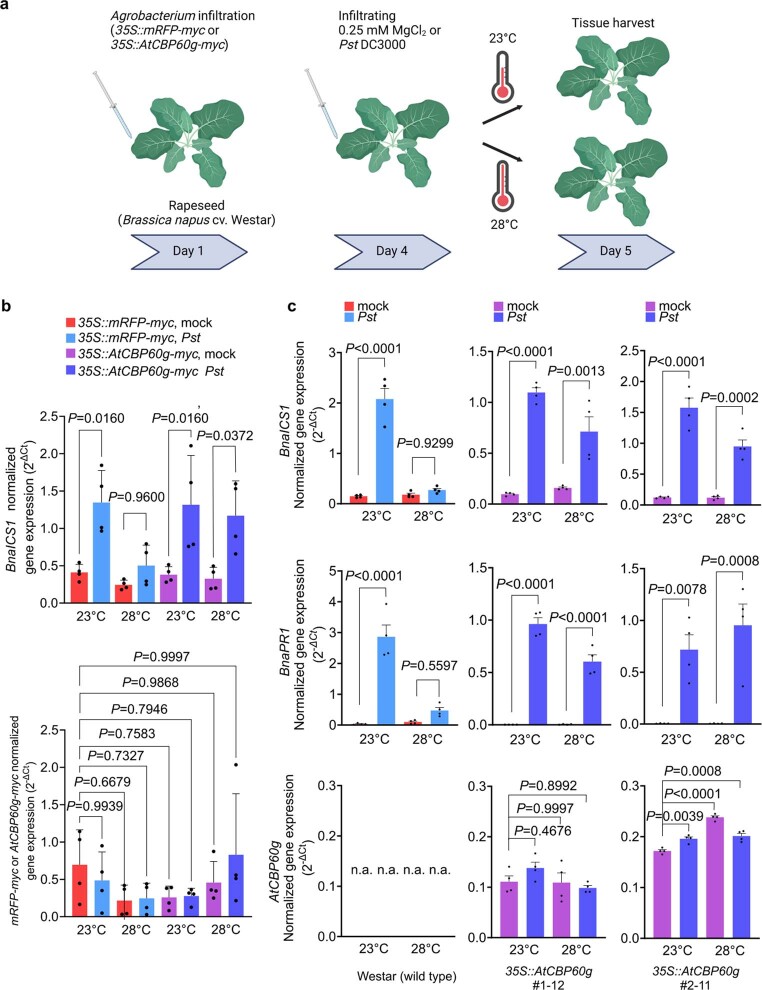
Extended Data Fig. 7. BnaICS and BnaPR1 transcript levels in transgenic rapeseed plants expressing AtCBP60g-myc.
a, A schematic diagram of experimental flow using Agrobacterium-mediated transient expression system. b, Transcript levels of BnaICS1 and myc-tagged transgenes (mRFP-myc or AtCBP60g-myc) in mock (0.25 mM MgCl2)- or Pst DC3000-infiltrated [1.0 x 10⁵ Colony Forming Units (CFU) mL−1] rapeseed leaves at 1 dpi. Leaves were pre-infiltrated with Agrobacterium suspension 3 days before mock or Pst DC3000 treatment. Results in (b) are the means ± S.D. (n = 4 biological replicates from two independent experiments). Statistical analysis was performed using two-way ANOVA with Tukey’s HSD. The experiment was repeated four times with similar results. c, Transcript levels of BnaICS1, BnaPR1 and AtCBP60g-myc in mock- or Pst DC3000-infiltrated [1.0 x 10⁵ Colony Forming Units (CFU) mL−1] wild-type and two independent 35S::AtCBP60g-myc transgenic rapeseed leaves. AtCBP60g transcript level in each leaf sample was quantified (bottom row). No AtCBP60g transcript was detected in Westar samples as control, whereas AtCBP60g transcript was detected in each 35S::AtCBP60g-myc sample. Data in (c) are the means S.E.M. (n = 4 biological replicates). The experiment was repeated twice. Statistical analysis was performed using two-way ANOVA with Tukey’s HSD. n.a., not applicable. Exact P-values for those comparisons that are greater than 0.05 are detailed in the Source Data files

