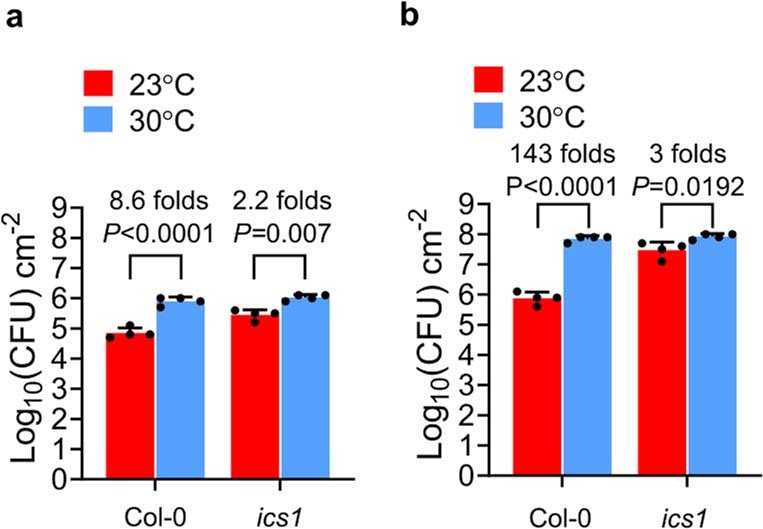
Extended Data Fig. 8. Pst DC3000 bacterial population levels in Arabidopsis Col-0 and the ics1 mutant.

a–b, In planta Pst [1.0 x 10⁶ Colony Forming Units (CFU) mL−1] bacterial levels in Col-0 and ics1 (i.e., sid2-2) plants at 23 °C and 30 °C at 1 (a) and 3 (b) dpi. Data are the means ± S.D. (n = 4 biological replicates). The experiment was repeated three times. Statistical analysis was performed using two-way ANOVA with Tukey’s HSD. Exact P-values for all comparisons are detailed in the Source Data files
