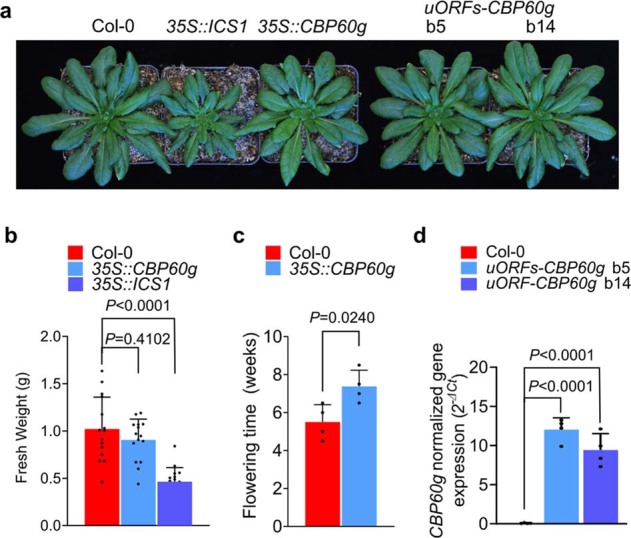
Extended Data Fig. 10. Characterization of 35S::ICS1, 35S::CBP60g and uORF-CBP60g plants.

a, Appearance of 6-week-old Col-0, 35S::ICS1, 35S::CBP60g and uORFs-CBP60g plants. b, Quantification of fresh weights of 6-week-old Col-0, 35S::ICS1, 35S::CBP60g. c, Flowering time phenotypes of Col-0 and 35S::CBP60g plants. d, CBP60g transcript levels in 4-week old Col-0, and 35S::uORFs-CBP60g plants measured by RT-qPCR. Results in (b) show the means ± S.D. [n = 15 (Col-0, 35S::CBP60g), n = 16 (35S::ICS1) biological replicates] from one representative experiment (of two independent experiments) analyzed with one-way ANOVA with Bartlett’s test for significance. Results in (c) show the means ± S.D. (n = 4 biological replicates) from one representative experiment (of two independent experiments) with two-tailed Student’s t-test. Results in (d) show the means ± S.D. (n = 4 biological replicates of two independent experiments) analyzed with one-way ANOVA with Bartlett’s test for significance. Exact P-values for all comparisons are detailed in the Source Data files
