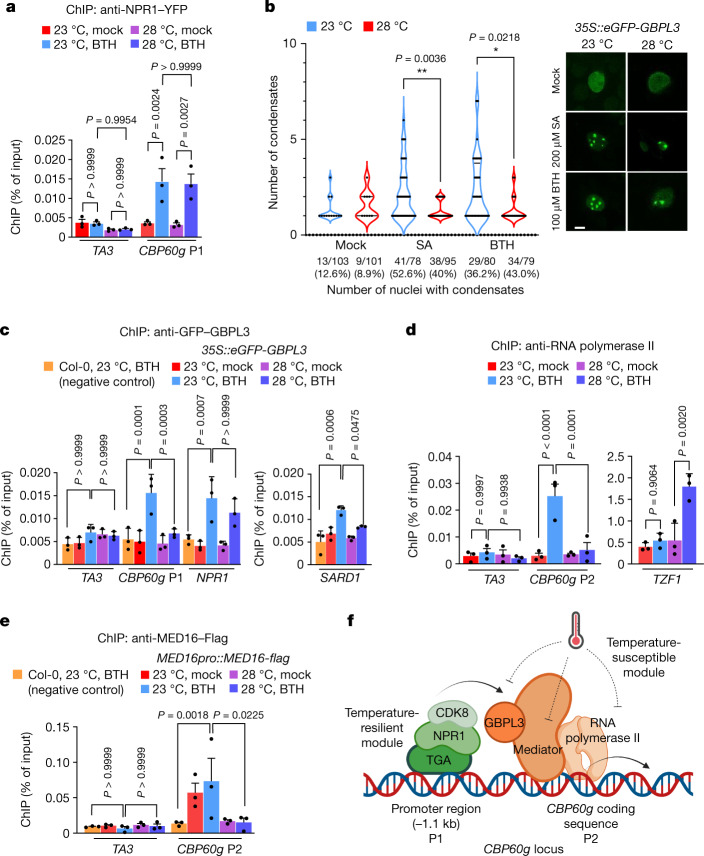
Fig. 2. Elevated temperature represses CBP60g promoter activity.
Four- to five-week-old Col-0 and indicated transgenic plants were treated with mock (0.1% DMSO) or 100 µM BTH solution and then incubated at 23 °C and 28 °C. ChIP–qPCR and confocal imaging were performed in plants one day after treatment. a, ChIP–qPCR analyses of NPR1pro::NPR1-YFP using anti-GFP antibody and indicated primer sets. The position of the CBP60g primer sequence is shown in f. b, Confocal imaging of eGFP–GBPL3 in 35S::eGFP-GBPL3 infiltrated with mock (0.1% DMSO), 200 µM SA or 100 µM BTH solution at 23 °C or 28 °C 1 day after treatment. Scale bar, 10 μm. c–e, ChIP–qPCR analyses of 35S::eGFP-GBPL3 (c), NPR1pro::NPR1-YFP (d) and MED16pro::MED16-flag (e) plants using the indicated antibodies and primer sets. f, Schematic showing known regulators binding at the CBP60g locus. Temperature-susceptible (green) and temperature-resilient (orange) modules are indicated. Primer positions (P1 for promoter region and P2 for coding region) are indicated. For ChIP analyses, the TA3 transposon was used as the negative control target locus in (a,c–e). A BTH-treated Col-0 sample incubated at 23 °C (c,e) was used as a negative control for immunoprecipitation. Results in (a,c–e) are mean ± s.d. of three independent experiments; two-way ANOVA with Tukey’s HSD. Images in b show one representative experiment (of four independent experiments); one-way ANOVA with Bartlett’s test. Exact P-values greater than 0.05 are shown in the Source Data.

