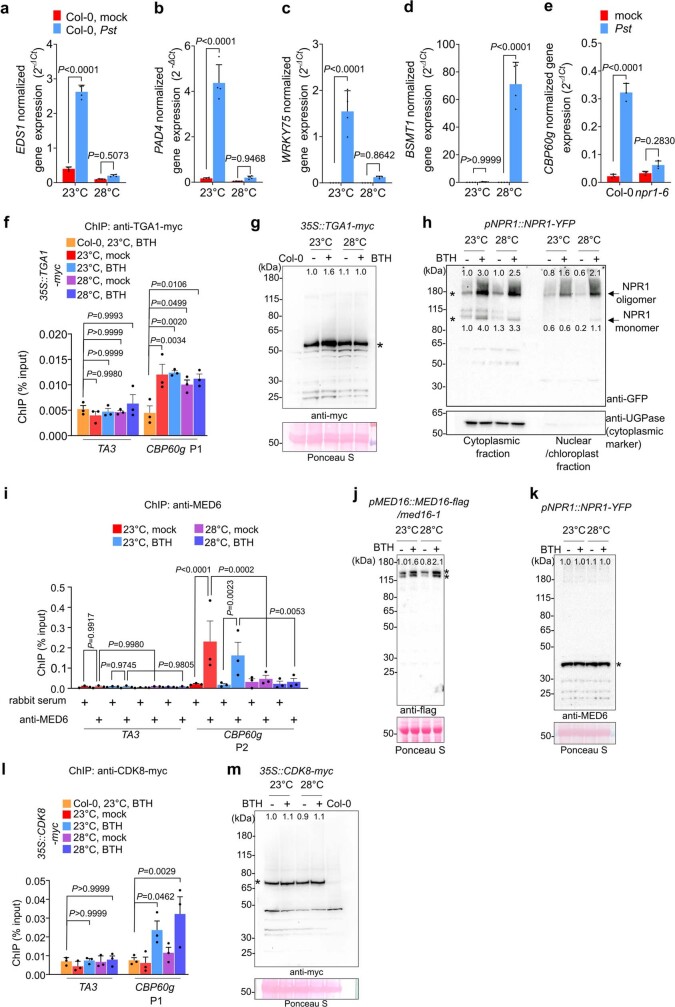
Extended Data Fig. 3. Effect of elevated temperature on transcript levels, protein levels and promoter recruitment of SA pathway regulators.
a–d, Endogenous EDS1 (a), PAD4 (b), WRKY75 (c), and BSMT1 (d) transcript levels of samples in Fig. 1b at 24 h after treatment (1 dpi). e, CBP60g gene expression levels in Col-0 and npr1–6 plants at 24 h after Pst DC3000 inoculation [1.0 x 10⁶ Colony Forming Units (CFU) mL−1] at 23 °C. f, ChIP-qPCR analysis of 35S::TGA1-4myc using anti-myc antibody and primer sets indicated in Fig.2f. Binding of TGA1-myc to CBP60g locus is not affected by temperature in mock (0.1% DMSO)- or BTH-treated samples (P-value = 0.7903 and 0.9566, respectively). g, Immunoblot results of 35S::TGA1-myc used for ChIP-qPCR analyses in (f). h, NPR1 immunoblot of NPR1pro::NPR1-YFP plant cytosolic and nuclear protein fractions 24 h after BTH treatment at 23 °C and 28 °C. Both NPR1 oligomers (high molecular weight) and monomers (low molecular weight) are indicated by arrowheads. Anti-UGPase immunoblot is shown as the cytoplasmic marker control. i, ChIP-qPCR results of NPR1pro::NPR1-YFP using anti-MED6 antibody and primer sets indicated in Fig.2f. j, Immunoblot result of MED16pro::MED16-3flag used for ChIP-qPCR analysis in Fig. 2e. k, Immunoblot results of NPR1pro::NPR1-YFP using anti-MED6 antibody used for ChIP-qPCR analyses in (i). l, ChIP-qPCR results of 35S::CDK8-myc using anti-myc antibody and primer sets indicated. m, Immunoblot results of 35S::CDK8-myc using anti-myc antibody used for ChIP-qPCR analyses in (l). For immunoblot (g, j, k, m), stained RuBisCO large subunits are shown as loading controls. Numbers in panels (g, h, j, k, m) indicate relative protein band signal intensities compared to the corresponding band denoted with a * symbol(s). For gel/blot source data, see Supplementary Fig. 1. For ChIP analyses, the TA3 transposon was used as the negative control target locus. Primer positions (P1 for promoter region and P2 for coding region) are indicated in Fig. 2f. Antibody information is included in Supplementary Table 5. Result in (a–e) shows the means ± S.D. [n = 4 (a–d) or 3 (e) biological replicates] from one representative experiment [of three (a–d) or two (e) independent experiments] analyzed with two-way ANOVA with Tukey’s HSD for significance. Results in (g, h, j, k, m) show one representative experiment [of two (g, h) or three (j, k, m) independent experiments]. Results in (f, i, l) are the average ± S.D. [of three independent experiments (n = 3 experiments)], analyzed with two-way ANOVA with Tukey’s HSD for significance. Exact P-values for those comparisons that are greater than 0.05 are detailed in the Source Data files

