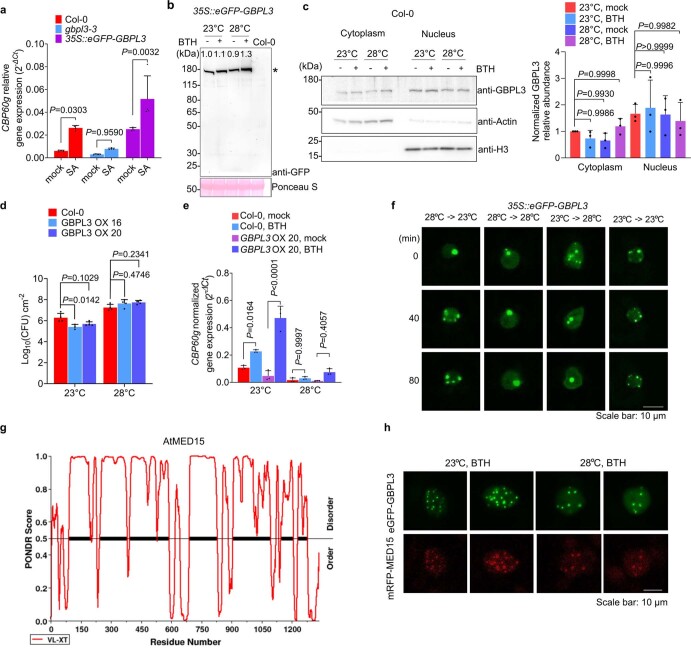
Extended Data Fig. 4. Characterization of 35S::eGFP-GBPL3 and GBPL3 OX plants.
a, CBP60g gene expression levels in Col-0, gbpl3-3, and 35S::eGFP-GBPL3 plants at 24 h (1 day) after mock (water) or 200 µM salicylic acid spray at 23 °C. b, Immunoblot results of 35S::eGFP-GBPL3 used for ChIP-qPCR analyses in Fig. 2c. Stained RuBisCO large subunits are shown as loading controls. Numbers in the panel indicate relative protein band signal intensities compared to the corresponding band denoted with a * symbol. c, Subcellular fractionation of Arabidopsis Col-0 leaf cells treated with mock (0.1% DMSO) or BTH for 24h at control (23 °C) or elevated temperature (28 °C). Actin and Histone H3 protein were used as markers of cytoplasmic and nuclear fractions, respectively. d, In planta Pst DC3000 [1.0 x 10⁶ Colony Forming Units (CFU) mL−1] bacterial levels in Col-0, GBPL3 OX #16 and GBPL3 OX #20 plants at 3 dpi. e, CBP60g gene expression levels of Col-0 and GBPL3 OX #20 plants at 24 h after mock (0.1% DMSO) or 100 µM BTH spray at 23 °C or 28 °C. f, Time lapse confocal microscopy of Arabidopsis mesophyll cell expressing eGFP-GBPL3 after transfer to 28 °C from 23 °C or to 23 °C from 28 °C. Scale bar, 10 µm. g, Prediction of intrinsically disordered region in AtMED15 (Threshold score: 0.5). h, Confocal microscopy of Nicotiana tabacum mesophyll cells transiently expressing eGFP-GBPL3 and mRFP-MED15 at 23 °C and 28 °C. Six to seven weeks old N. tabacum leaves were infiltrated with Agrobacterium harbouring 35S::eGFP-GBPL3 or 35S::mRFP-MED15-flag. After incubation for 3 days at control temperature, the plants were treated with 100 µM BTH solution and shifted to 23 °C or 28 °C. After 1 day, mesophyll cells were visualized by confocal microscopy. Scale bar, 10 µm. Results in (a, d, e) show the means ± S.D. [(a) n = 4, (d) n = 4 except GBPL3 OX 16 at 23 °C (n = 3 biological replicates), or (e) n = 3 biological replicates] from one representative experiment (of two independent experiments), analyzed with two-way ANOVA with Tukey’s HSD for significance. Results in (b, left panel of c) show one representative experiment (of three independent experiments). Result in (right panel of c) shows the means ± S.D. (of three independent experiments) analyzed with one-way ANOVA with Bartlett’s test for significance. Results in (f, h) show one representative experiment (of two independent experiments). Exact P-values for all comparisons are detailed in the Source Data files

