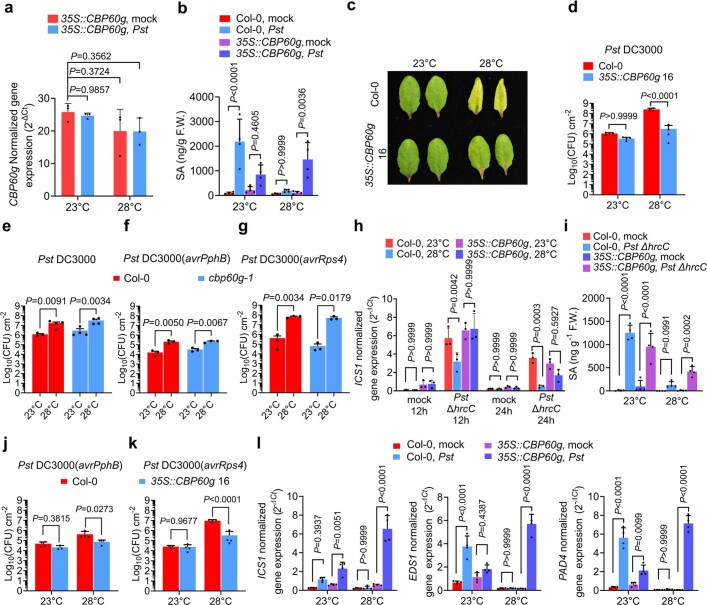
Extended Data Fig. 5. Characterization of 35S::CBP60g 16 and cbp60g-1 plants.
a, CBP60g transcript levels in 4-week old 35S::CBP60g at 23 °C or 28 °C 1 day after mock (0.25 mM MgCl2) treatment or Pst DC3000 infection [1.0 x 10⁶ Colony Forming Units (CFU) mL−1]. b–d, SA levels at 1 dpi (b), symptom expression at 3 dpi (c) and in planta Pst DC3000 [1.0 x 10⁶ Colony Forming Units (CFU) mL−1] bacterial levels at 3 dpi (d) of Col-0 and 35S::CBP60g 16 plants. e–g, bacterial levels in Col-0 and cbp60g-1 plants inoculated with Pst DC3000 (e), Pst DC3000 (avrPphB) (f), and Pst DC3000 (avrRps4) (g) at 3 dpi. h, ICS1 gene expression levels in Pst DC3000 ΔhrcC-infected Col-0 and 35S:CBP60g plants [1.0 x 10⁸ Colony Forming Units (CFU) mL−1] at 12- and 24-h post-inoculation (hpi). i, SA levels in Pst DC3000 ΔhrcC-infected Col-0 and 35S:CBP60g plants (1.0 x 10⁸ Colony Forming Units (CFU) mL−1) at 24 h post-inoculation. j–k, In planta Pst DC3000 (avrPphB) (j), and (avrRps4) (k) bacterial levels of Col-0 and 35S::CBP60g 16 plants at 3 dpi. l, ICS1, EDS1 and PAD4 gene expression levels of Col-0 and 35S::CBP60g plants 1 day after mock (0.25 mM MgCl2)- and Pst DC3000-infiltration [1.0 x 10⁶ Colony Forming Units (CFU) mL−1]. Results show the means ± S.D. [n = 3 (a, f, g, h) or 4 (b, d, i) biological replicates] from one representative experiment [of two (a, h, i) or three (b, d, f, g) independent experiments] analyzed with two-way ANOVA with Tukey’s HSD for significance. Results in (e) show the means ± S.D. [n = 4 biological replicates except Col-0 at 23 °C (n = 3 biological replicates)] from one representative experiments (of three independent experiments) analyzed with two-way ANOVA with Tukey’s HSD for significance. Results in (j) show the means ± S.D. [n = 4 (Col-0) or 3 (35S::CBP60g 16) biological replicates] from one representative experiments (of three independent experiments) analyzed with two-way ANOVA with Tukey’s HSD for significance. Results in (k) show the means ± S.D. [n = 4 biological replicates except 35S::CBP60g 16 at 23 °C (n = 3 biological replicates)] from one representative experiments (of three independent experiments) analyzed with two-way ANOVA with Tukey’s HSD for significance. Exact P-values for those comparisons that are greater than 0.05 are detailed in the Source Data files

