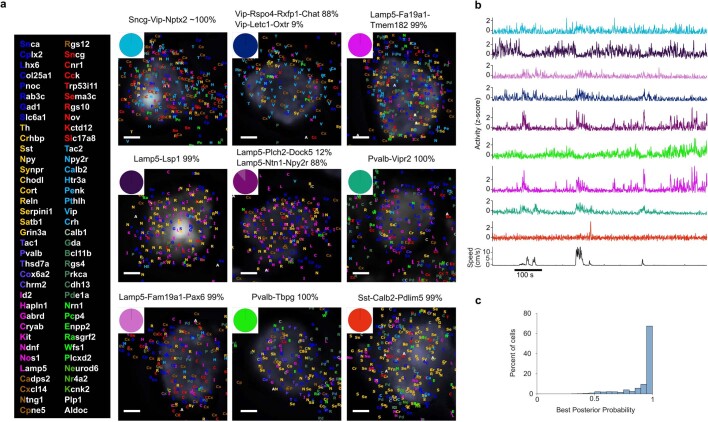
Extended Data Fig. 4. Example cells.
a, Nine example cells which were recorded during the same session as in Fig. 2. Pie plots indicate the posterior probabilities of each cell’s subtype assignment. Grey background images show DAPI-stained nuclei. Each gene detection is represented by coloured letters (key to the left). Scale bars: 2 µm. b, Activity of these 9 cells during spontaneous behaviour, together with the running speed of the mouse. The traces are colour coded according to the assigned subtype for each cell (pie plots in a). c, Analysis of Bayesian classification confidence. Histogram shows posterior probability for a cell to belong to its assigned subtype, for in vivo imaged cells. About 2% of cells for which confidence was below 50% were not analysed further.

