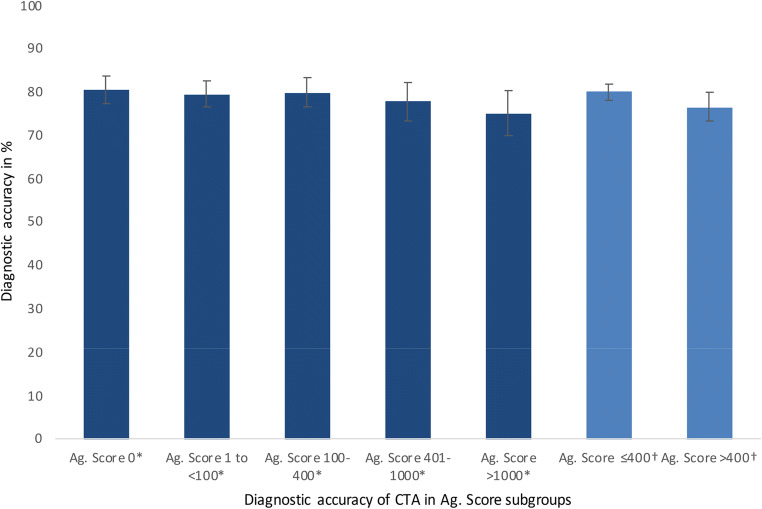
Fig. 4.
Similar diagnostic accuracy of CTA in patients with low, intermediate, moderately, and highly increased Agatston scores. Error bars based on 95% CI. *Diagnostic accuracy of CTA was not significantly different in Agatston score subgroups. † Equally, additional analysis in patients with an Agatston score of ≤ 400 versus > 400 showing diagn ostic accuracy of CTA not significantly different in both groups. Ag. Score, Agatston score; CTA, computed tomography angiography

