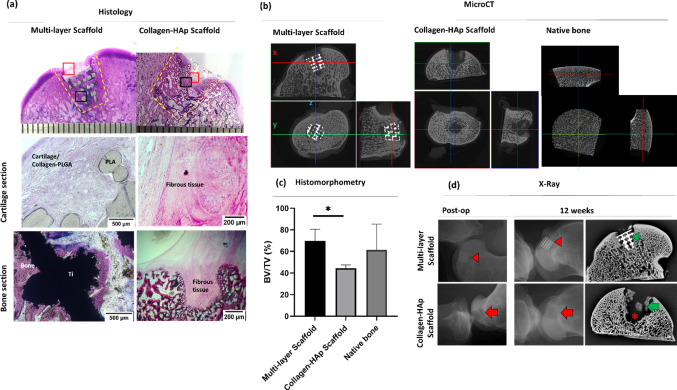
Fig. 7.
Bone regeneration: a Undecalcified histology of the multi-layer scaffold and collagen–HAp scaffold groups show bone formation surrounding the Ti matrix and tissue ingrowth into the PLA section, while fibrous tissue formation is observed in the collagen–HAp scaffold group. b The micro-CT sections of samples in both groups clearly show the presence of voids in the collagen–HAp scaffold group. c The histomorphometry analysis from histology showed significantly higher (p = 0.01) bone volume/total volume (bone ingrowth) in the multi-layer scaffold group. The BV/TV of native bone taken from the literature [39]. d Evaluation of bone formation. The X-ray micrographs of mid-sections of both groups and the X-ray of the joint immediately after the operation and at 12 weeks showing multi-layer scaffold and collagen–HAp scaffold samples. The red asterisk shows the lack of bone formation in the collagen–HAp scaffold group, with only patches of new bone (green arrow). The green arrowhead shows bone ingrowth into the Ti matrix. The red arrowhead indicates the position of the scaffold and its fixation within the joint. The area shown by the red arrow depicts the position of the collagen–HAp scaffold (note the reduced opacity)

