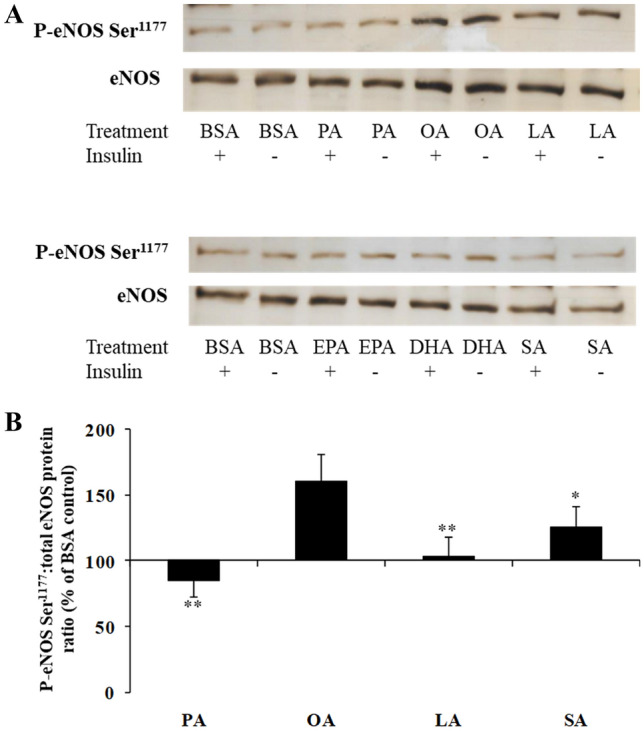
Fig. 3.

A A typical Western blot analysis of phosphorylated eNOS Ser1177 and total eNOS after incubation of HAEC cells with 100 µM PA, OA, LA and SA, and 10 µM EPA and DHA followed by stimulation with and without insulin (1 µM) for 15 min. B Greater eNOS phosphorylation at Ser1177 with OA. Each bar represents the phosphorylated:total eNOS protein ratio after incubation of HAEC with 100 µM of PA, OA, SA and LA relative to the BSA control, which is arbitrarily set at 100%. Data are pooled from several independent cell experiments (n = 10–12). **P ≤ 0.009 and *P = 0.047, relative to OA
