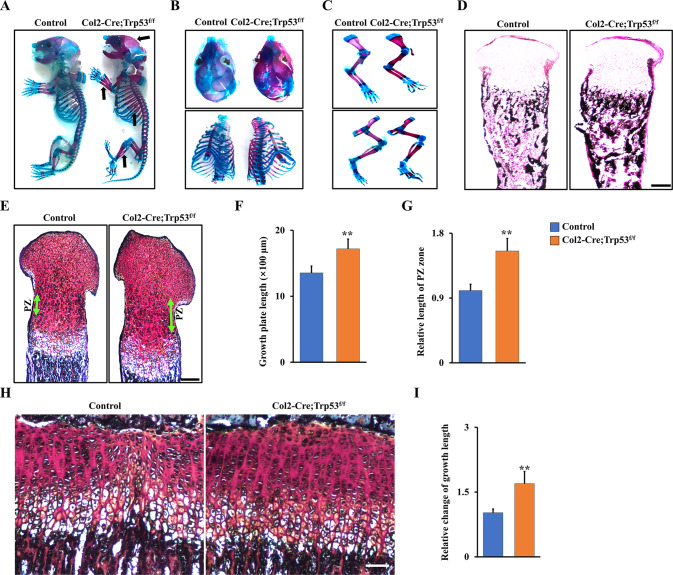
Fig. 2. Trp53 is required for normal skeletal development.
A–C Representative whole-mount skeletal-stained images as indicated at P0. The black arrows direct to the regions of enhanced bone mass at P0. D Representative von Kossa-stained images in the tibiae as indicated at P0. N = 3. Scale bars, 75 μm. E Representative Safranin O-stained images as indicated at P0. Green arrow directs to the proliferation zone (PZ). Scale bars, 100 μm. F Quantitative analysis of growth plate length in the newborn tibiae as indicated. N = 3. G Relative analysis of PZ’s lengths in the newborn tibiae as shown. N = 3. H, I Representative Safranin O-stained images as indicated at 1 month (H). Scale bars, 5 μm. The fold change of the growth plate length from (H) was identified (I). N = 3. **P < 0.01.

