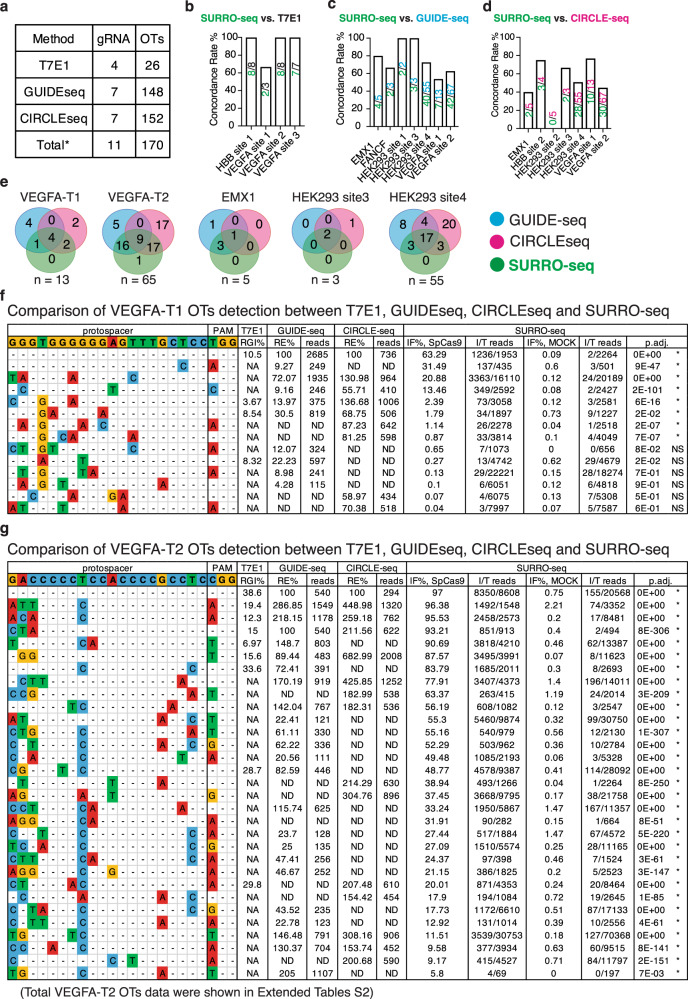
Fig. 2. Validation of RGN OTs detection between T7E1, GUIDE-seq, and/or CIRCLE-seq by SURRO-seq.
a Overview of RGN gRNAs and OTs selected for validated with SURRO-seq. b–d Comparison of the OT detection concordance rate between SURRO-seq and T7E1 (b), GUIDE-seq (c) and CIRCLE-seq (d). Numbers are total OTs for each RGN (upper) evaluated with the compared method and OTs agreed with SURRO-seq (lower). e Venn diagram comparison of OTs with significant significantly detectable off-targets (SURRO-seq) and OTs with deep sequencing reads detected by GUIDE-seq or CIRCLE-seq. Numbers are OT sites. f–g Comparison of VEGFA-T1 (f) and VEGFA-T2 (g) OT detections between T7E1, GUIDE-seq, CIRCLE-seq and SURRO-seq. Full results are showed in Supplementary Data 2. RGI, relative gel intensity; RE%, percentage of relative efficiency, calculated by % reads in OT per reads in ON; IF, indel frequency; I/T reads, indel/total reads; P values for comparison between SpCas9 and MOCK IF% are calculated with Benjamini and Hochberg (BH)-adjusted Fisher’s exact test (two-sided). *, represents OT with significantly detectable indels (adj. P value < 0.05, FC (IF% SpCas9/ IF% MOCK) > = 2). NS, represents OTs with not significantly detectable indels.

