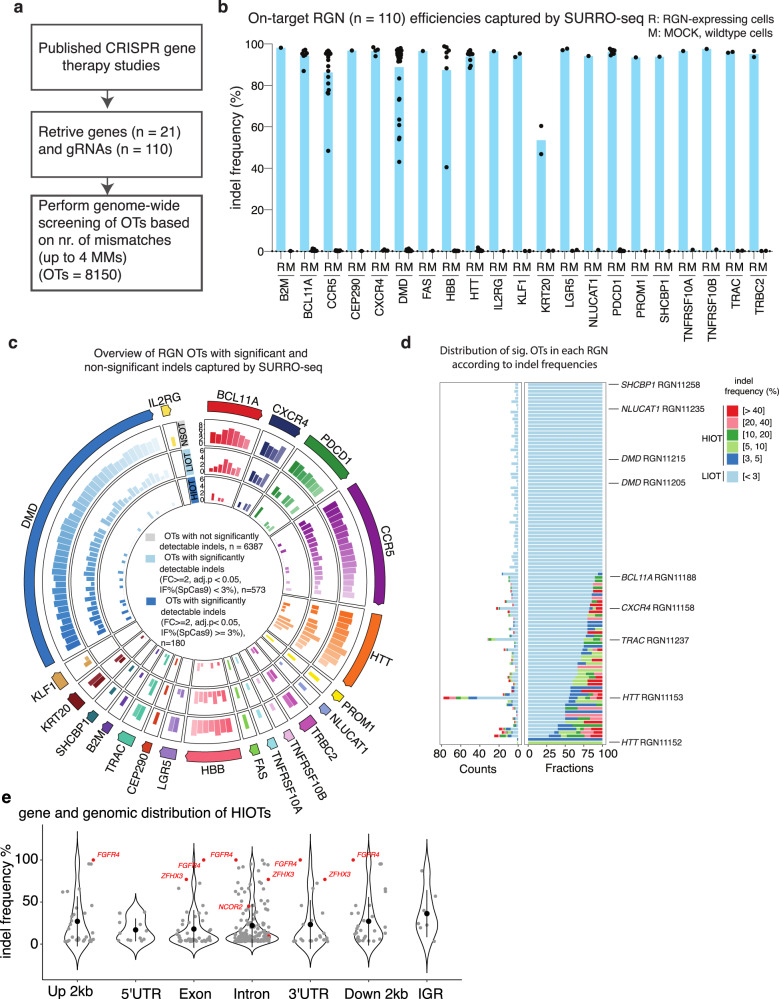
Fig. 3. High throughput evaluation of gene therapy RGN OTs with SURRO-seq.
a Overview of gene therapy RGN selection and number of OTs captured. b Quantification of indel frequencies for the 110 RGNs by SURRO-seq. R, RGN edited, M, MOCK control. c Overview of the number of RGNs OTs with not significantly detectable indel (NSOT, outer circle, adj. P value > 0.05 or FC (IF% SpCas9/ID MOCK < 2)), with significantly detectable indels (adj. P value < 0.05 and FC (IF% SpCas9/ID MOCK > = 2)) but low indel frequency (<3%, LIOT, middle circle), and significantly detectable indels with high indel frequency (> = 3%, HIOT, inner circle). P values are derived from Benjamini and Hochberg (BH)-adjusted Fisher’s exact test (two-sided). d Bar plot of total number (left) and fraction (right) of LIOTs and HIOTs for the RGNs. e Violin plot of the gene and genomics location of the HIOTs and indel frequency. OTs in cancer genes are highlighted in red. Data are presented as mean values +/− SD.

