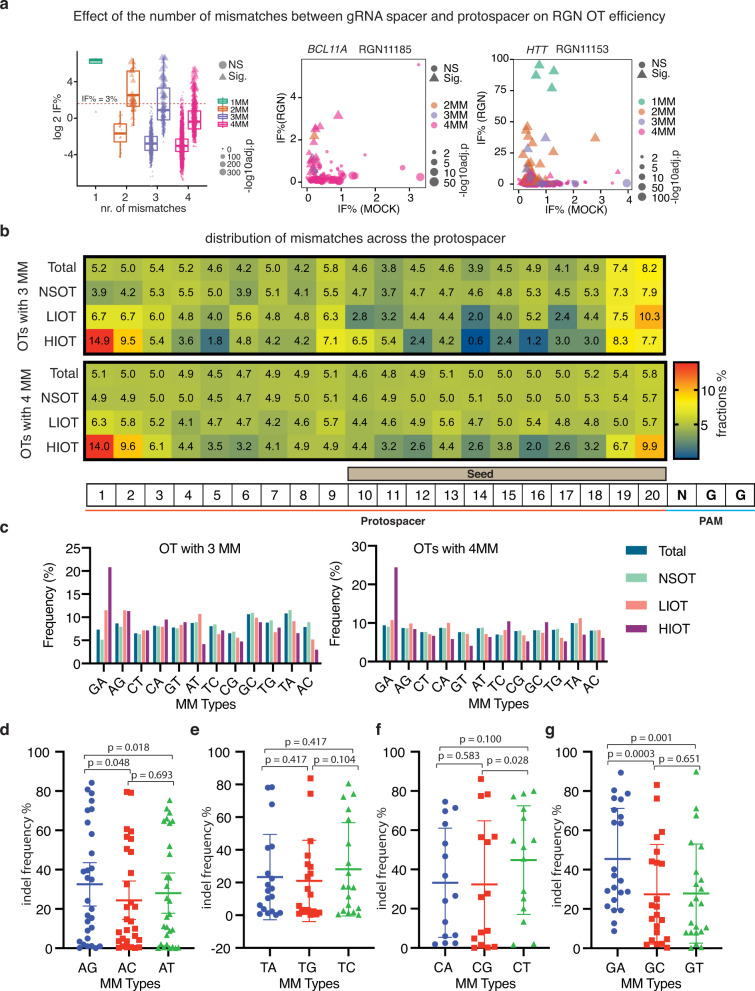
Fig. 5. Effects of mismatch number, position and type on RGN off-target activity.
a Box-and-whisker plot of log 2 indel frequency for RGN OTs evaluated by SURRO-seq in LibB. Data are presented as values representing the median (line within the box), the interquartile range (length of the box), the 75 and the 25th percentiles (whiskers above and below the box) of the indel frequencies. Sites were grouped based the number of mismatches (MM), plotted according to significance and log10 adj. p-values (Benjamini and Hochberg (BH)-adjusted Fisher’s exact test (two-sided)). NS, RGN OTs with not significantly detectable indels; Sig. RGN OTs with significantly detectable indels. One mismatch (NS, N = 0 biologically independent RGN OTs; Sig, N = 6 biologically independent RGN OTs), two mismatches (NS, N = 26 biologically independent RGN OTs; Sig, N = 49 biologically independent RGN OTs), three mismatches (NS, N = 501 biologically independent RGN OTs; Sig, N = 140 biologically independent RGN OTs), and four mismatches (NS, N = 5860 biologically independent RGN OTs; Sig, N = 558 biologically independent RGN OTs). b Heatmap presentation of the fraction of mismatches occurred in each position of the gRNA for OTs in LibB, grouped based on total OTs, NSOTs, LIOTs and HIOTs. c Bar plot of appearance frequencies of each type of mismatches occurred in the different groups of RGN OTs in LibB. d–g Dot plots of indel frequencies for OTs with one mismatch measured in LibC. One-way pair-wise ANOVA analysis was performed for A type mismatches (d, N = 30 biologically independent mismatch sites), T type mismatches (e, N = 20 biologically independent mismatch sites), C type mismatches (f, N = 18 biologically independent mismatch sites), and G type mismatches (g, N = 28 biologically independent mismatch sites). Data are presented as mean values +/− SD. Indel frequency values can be found in Supplementary Data 5 (5.4–5.7).

