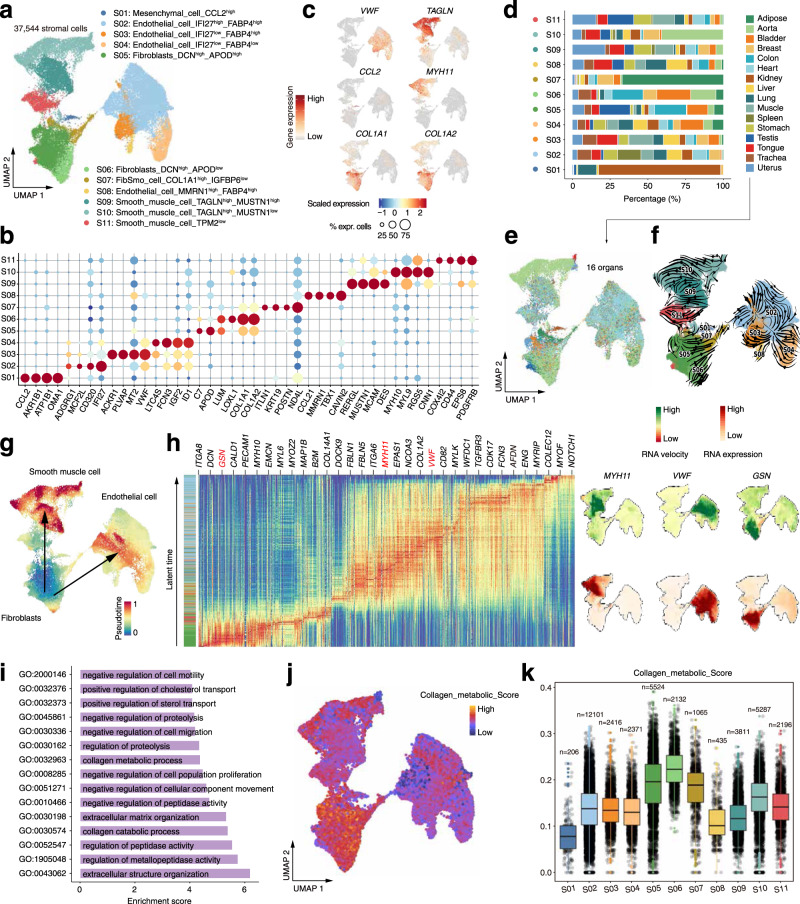
Fig. 3. Heterogeneity of stromal cells in different organs.
a Distribution of eleven stromal cell subtypes on the UMAP. b Dot plots showing representative marker genes across the stromal subtypes. Dot size is proportional to the fraction of cells expressing specific genes. Color intensity corresponds to the relative expression of specific genes. c Feature plot showing the expression of selected marker genes. d Bar plot showing the percentage of cell subtypes in each organ. e Distribution of stromal cells from different organs on the UMAP. f Unsupervised pseudotime trajectory of the subtypes (S01-S11) of stromal cells by RNA velocity analysis. Trajectory is colored by cell subtypes. The arrow indicates the direction of cell pseudo-temporal differentiation. g UMAPs showing the pseudotime differentiation trajectories of fibroblasts, smooth muscle cells and endothelial cells respectively. h Heatmap showing the scaled expression levels of cell-type-specific marker genes along the pseudotime differentiation trajectory. Examples of marker expression are shown in the right UMAPs. i Barplot showing the enrichment of functional pathways in fibroblasts (cluster S06). j, k UMAP plot and Box plot showing the distribution of gene signature scores estimated by UCell based on annotated genes (n = 24) from the collagen metabolic pathway. The boxes indicate the 25% quantile, median (horizontal line), 75% quantile and Tukey-style whiskers (beyond the box).

