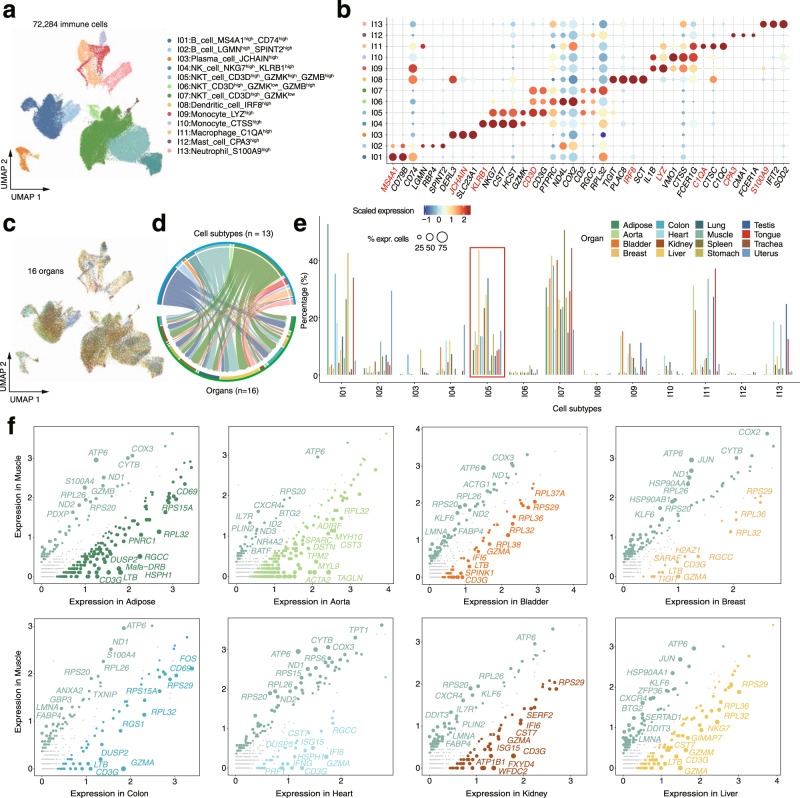
Fig. 4. Immune cell heterogeneity in cynomolgus monkeys.
a Distribution of 13 major immune cell types on the UMAP. b Dot plots shows representative top marker genes across the immune subtypes. c Distribution of immune cells from different organs on the UMAP. d Chord diagram mapping cells between cell types and organs. The width of the arrow represents the proportion of cell types. e Bar chart showing the proportion of cells from different organs for each cell subtype. f Scatter plots showing differentially expressed genes (DEGs) between muscle and other organs. Each dot represents a DEG, and its size is proportional to the fold change.

