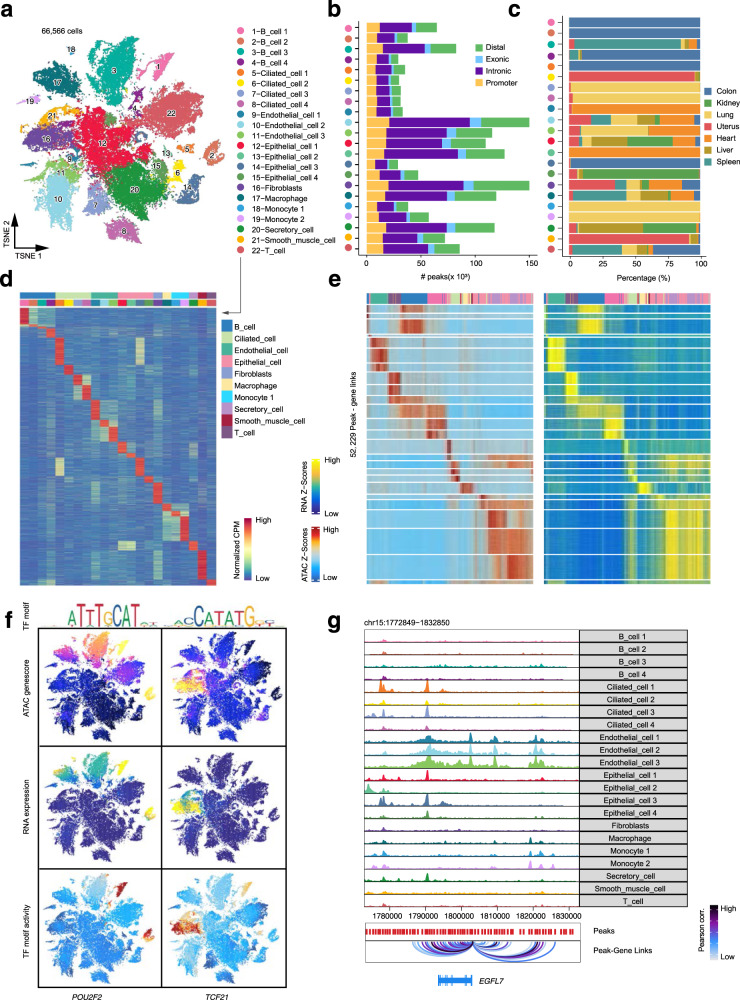
Fig. 6. Single-cell chromatin landscape of major organs in cynomolgus monkeys.
a scATAC-seq data analysis revealing 66,566 cells and 22 cell subtypes. Shown is the t-SNE of cells colored by cell subtypes. b Bar plot showing the number of reproducible peaks identified from each cluster. The peaks are classified into four categories: distal, exonic, intronic and promoter. c Bar plot dhowing the percentage of cell subtypes in each organ. d Heatmap of 80,270 marker peaks across 22 subclusters identified by bias-matched differential testing (FDR < 0.01 and log2FC > 3). e Heatmap illustrating the chromatin accessibility and gene expression of 52,229 significantly (Pearson correlation r > 0.45 and adjusted p-value < 0.1, provided by chromVAR) linked peak-gene pairs. f Profile of POU2F2 and TCF21 chromatin accessibility, gene expression (inferred from scRNA-seq) and TF motif activity. g Visualization of the EGFL7 locus with the maximum number of peak-gene pairs shown by genome browser track (chr15: 1,772,849-1,832,850).

