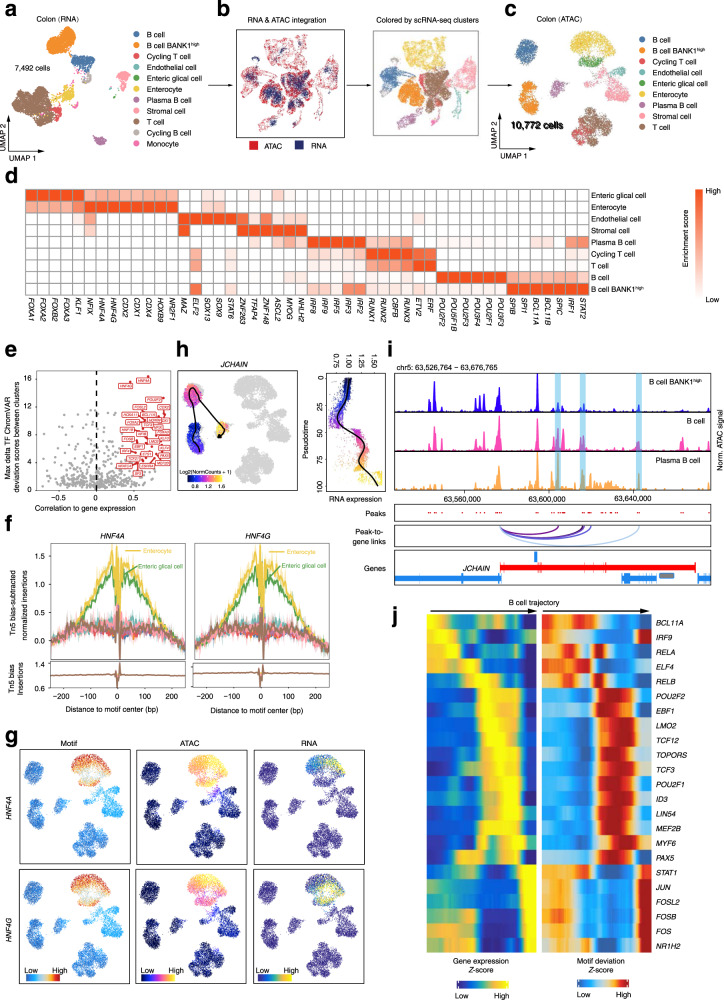
Fig. 7. Integrative analysis of scRNA-seq and scATAC-seq data in colon.
a UMAP plot showing the cell types identified by scRNA-seq data in colon. b UMAP plot showing the joint clustering of scRNA-seq (blue) and scATAC-seq (red) data in colon. Cells in the right UMAP are colored based on cell types annotated by scRNA-seq data. c UMAP plot showing the colon scATAC-seq cell types, which are inferred by scRNA-seq data. Note that cycling B cell and monocyte are not captured in scATAC-seq assay. d The heatmap showing the enrichment of the TF motif in cell-type-specific peaks. e Dot plot showing the identification of positive TF regulators through correlation of chromVAR TF deviation scores and gene expression in cell groups (Pearson correlation r > 0.5, adjusted p-value < 0.01 and deviation difference in the top 25th percentile). f TF footprint for the HNF4A and HNF4G motif with the subtracting the Tn5 bias normalization method. g Profile of the HNF4A and HNF4G gene chromatin accessibility, gene expression (inferred from scRNA-seq), and TF motif activity. h The dynamic of chromatin accessibility (left) and gene expression (right) of the JCHAIN gene along the B cell pseudo-time trajectory. i Genome track visualization of the JCHAIN locus (chr5: 63,526,764–63,676,765). Inferred peak-to-gene links for distal regulatory elements are shown below. j Heatmap showing the positive TF regulators for which gene expression is positively correlated with TF deviation (inferred by chromVAR) across the B cell trajectory.

