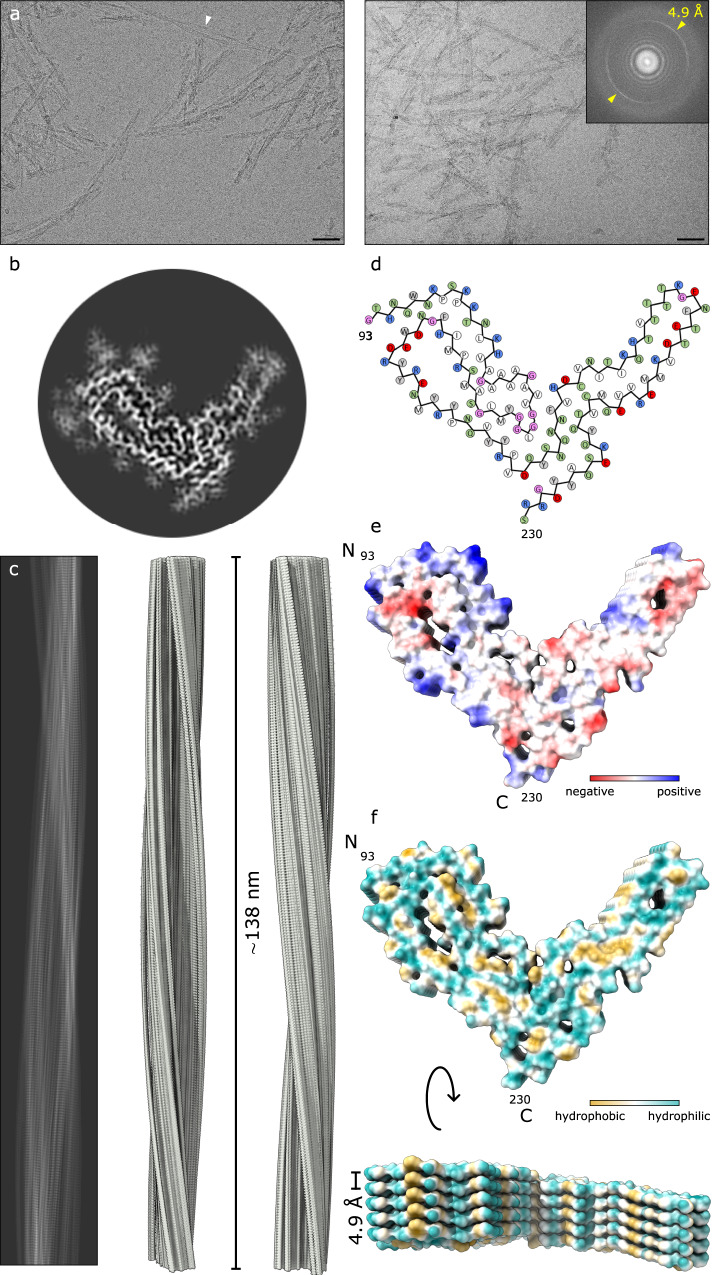
Fig. 1. Cryo-EM-based structure of aRML fibrils.
a 2D cryo-EM images of aRML fibrils. Bar = 50 nm. Inset depicts associated Fast Fourier transform showing signals from regular 4.9 Å spacings (yellow arrows). The white arrowhead indicates a rare example of aRML fibrils that appear to be paired. Micrographs shown are representative of 2272 movies collected for subsequent image processing and single particle analysis (see the “Methods” section). b Cross-sectional view of a density map projection. c Lateral view of the fibril density map with cross-over distance as indicated. d Core sequence showing relative orientations of side chains. Green, polar; blue, basic; red, acidic; white, aliphatic; gray, aromatic; pink—glycine. e Coulombic charge representation. f MLP hydrophobicity surface plot demonstrating interspersed hydrophobic interactions.

