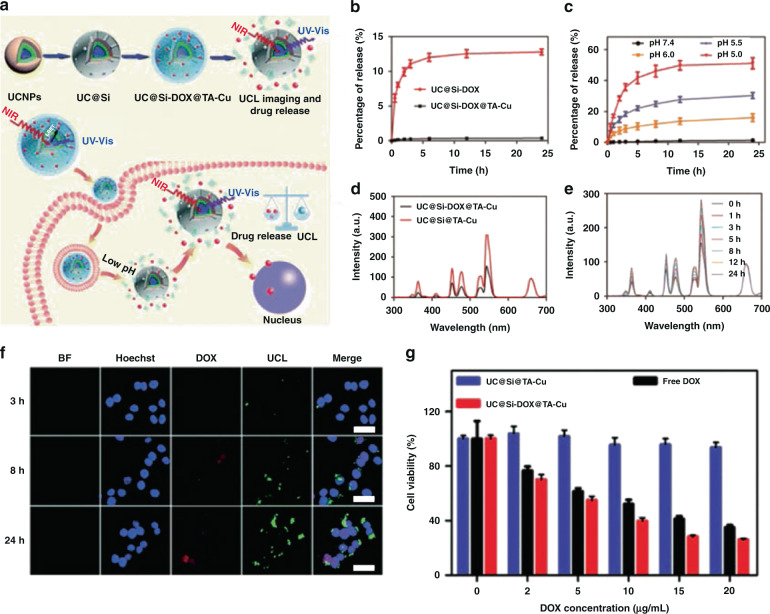
Fig. 6. Chemotherapy.
a Schematic illustration of the fabrication of UC@Si-DOX@TA–Cu and pH-responsive drug release monitored by UCL imaging in real time. b Drug release profiles for UC@Si-DOX@TA–Cu and UC@Si-DOX in phosphate buffer saline (PBS) at pH 7.4. c Drug release profiles for UC@Si-DOX@TA–Cu in PBS at pH 7.4, 6.0, 5.5 and 5.0. d The UCL spectra of UC@Si@TA–Cu and UC@Si-DOX@TA–Cu. e Time-dependent UCL spectra of UC@Si-DOX@TA–Cu after immersing in PBS solution (pH = 5.5). f Confocal fluorescence images of HeLa cells after incubation with UC@Si-DOX@TA–Cu for 3, 8 and 24 h. Scale bar: 40 μm. g Viability of HeLa cells incubated with UC@Si@TA–Cu, DOX and UC@Si-DOX@TA–Cu at varying concentrations94. Reprinted with permission from ref. 94 Copyright 2019, The Royal Society of Chemistry

